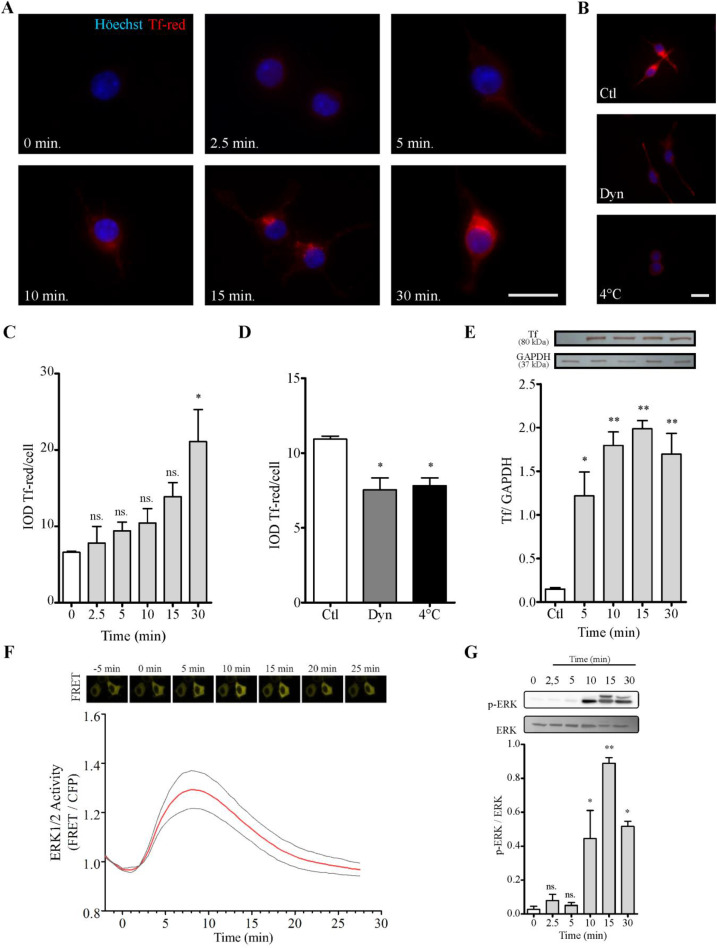
Figure 2.
N2a cells incorporate Tf. (Panel A) Immunofluorescence images of Tf-red incorporation performed in cultures incubated with Tf-red (100 µg/ml) for time periods ranging from 0 to 30 min. (Panel B) Images of Tf-red incorporation at 4°C and 37°C in the presence or absence of Dyn, a cell-permeable inhibitor of dynamin, for 15 min. Höechst nuclear dye is shown in blue (A and B). Scale bars represent 20 µm for all images in Panels A and B. (Panel C) Quantitation of Tf-red from images shown in A. Tf-red IOD was normalized to total nuclei. (Panel D) Quantitation of Tf-red from images shown in B. Tf-red IOD was normalized to total nuclei. (Panel E) WB analysis of Tf incorporation at different time periods using an anti-Tf antibody. Quantitation is expressed as the Tf/GAPDH ratio. (Panel F) EKAREV sensor evaluation of ERK1/2 activity in N2a cells stimulated with Tf (100 µg/ml) at time 0. The time course of FRET changes was measured at single-cell level. (Panel G) WB analysis of whole N2a lysates treated with Tf (100 µg/ml) for time periods ranging from 0 to 30 min. ERK phosphorylation levels were assessed as the pERK/ERK ratio. Bars in C, D, E, and G represent the mean ± SEM for two independent experiments using one-way ANOVA followed by Dunnett’s multiple comparison test. **p < 0.01, *p < 0.05, ns = non-significant. Symbols above bars indicate significance compared to corresponding control. Note. Dyn = dynasore; GAPDH = glyceraldehyde 3-phosphate dehydrogenase; IOD = integrated optical density; Tf = human transferrin; Tf-red = human transferrin-Texas Red; FRET = fluorescence resonance energy transfer.

