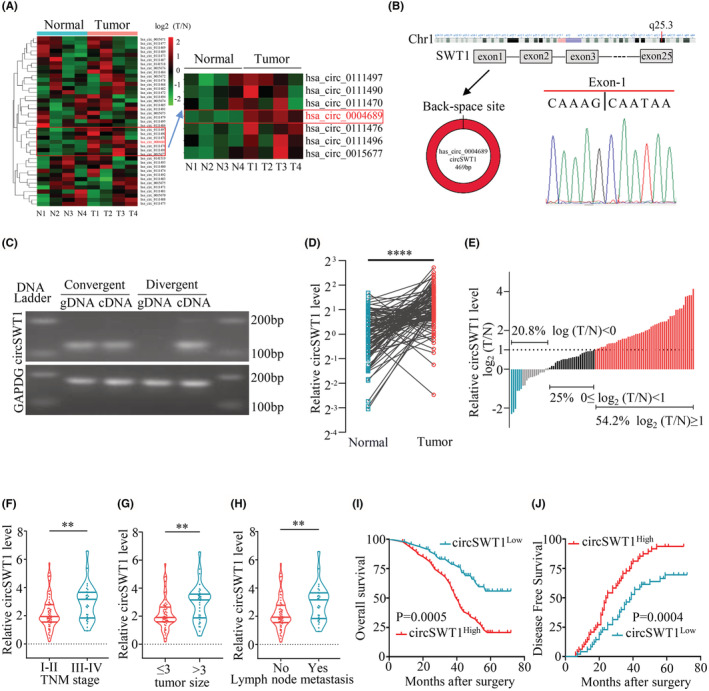
FIGURE 1.

Clinicopathological characterization of circSWT1 in NSCLC patients. (A) Heatmap of SWT1‐derived circRNA levels in 4 NSCLC tissues and paired normal tissues from NSCLC patients. (B) Structural schematic diagram of circSWT1 (left) and Sanger sequencing showing the back‐splicing site of circSWT1 (right). (C) PCR results of circSWT1 with divergent or convergent primers from cDNA and gDNA. [(D) and (E)] The level of circSWT1 was measured in 96 paired NSCLC tissues (T) and paired normal tissues (N) by qRT‐PCR. (F) The relationship between circSWT1 level and TNM stage (I‐II vs. III‐IV). (G) The relationship between circSWT1 level and tumor size (≤3 cm vs. >3 cm). (H) The relationship between circSWT1 level and lymph node metastatic status (yes vs. no). [(I) and (J)] Ninety‐six tumor patients were separated into two groups based on circSWT1 level (circSWT1High vs. circSWT1Low), and the overall survival rates and disease free survival rates of each group were calculated using Kaplan–Meier and log‐rank analyses. The data are presented as the mean ± SD of three independent experiments. **p < 0.01, ****p < 0.0001, ns: not significant.
