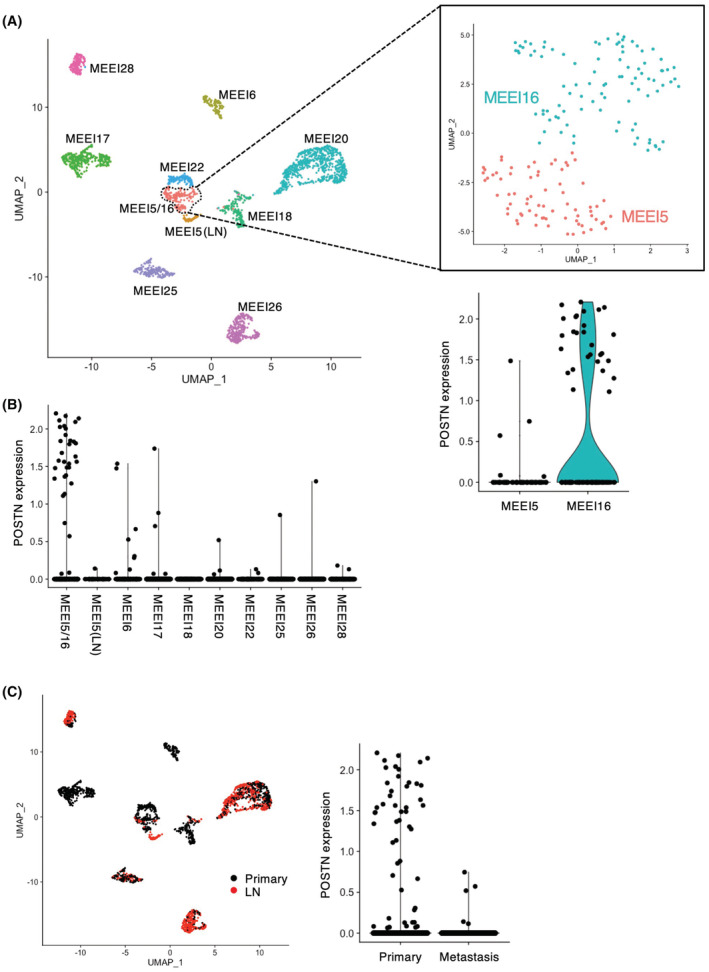
FIGURE 1.

POSTN expression in the heterogeneity of cancer cells within the HNSCC tissues. The processed RNA‐seq data obtained from the GEO database (accession number: GSE103322) was used. 31 (A) UMAP plot of cancer cells from 10 patients (indicated by colors) reveals tumor‐specific clusters. Zoomed in UMAP plot of MEEI5/16 with MEEI5 and MEEI16, which can be seen to further divide into two subclusters. Violin plot depicts distributions of the POSTN expression in MEEI5/16 cluster. (B) Cells with POSTN expression are plotted in each cluster. (C) Cells from primary tumors and metastatic lymph nodes are colored black and red. Violin plot depicts distributions of the POSTN expression in the cells.
