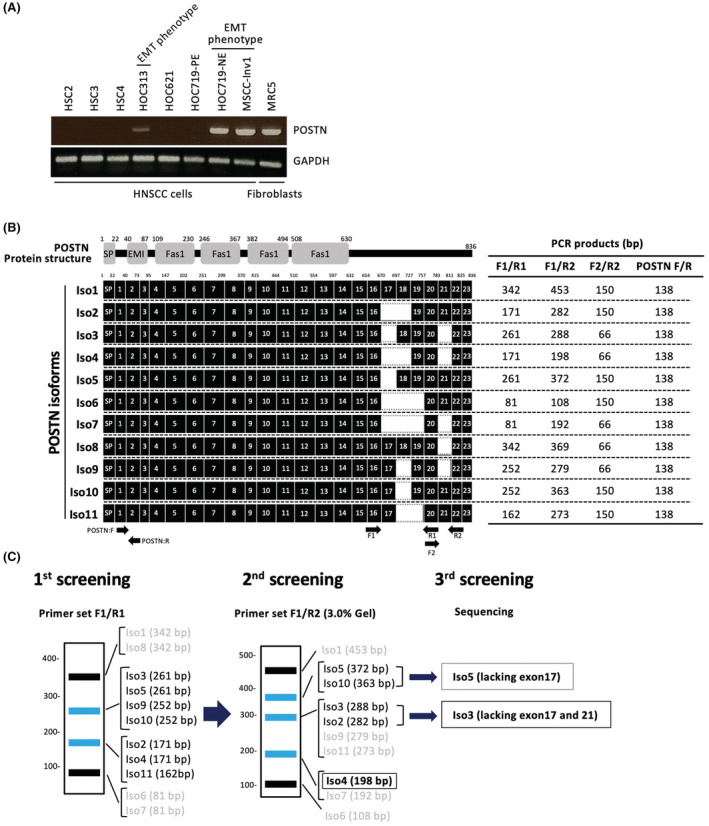
FIGURE 2.

The schematic model of screening methods for POSTN isoforms. (A) POSTN expression was examined by RT‐PCR in HNSCC cell lines and normal fibroblast. GAPDH was used as a control. (B) Periostin protein structure and isoforms (Iso1‐11) are shown. Moreover, primers (F1, F2, R1, and R2) and the product size of each primer set F1/R1, F1/R2 and F2/R2 are shown. (C) The screening method for determination of POSTN isoforms using each primer sets.
