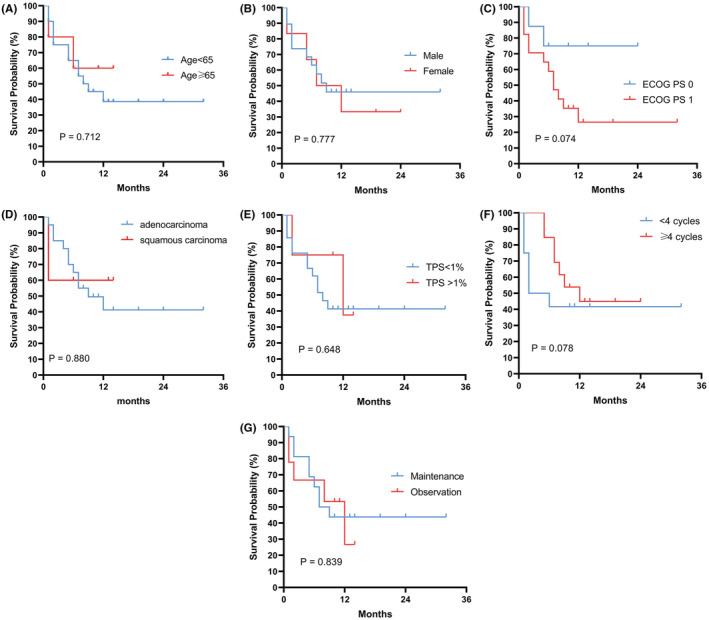
FIGURE 3.

Kaplan–Meier curves for subgroup analysis of PFS. (A) Age; (B) Sex; (C) ECOG PS; (D) Pathology; (E) PD‐L1 tumor proportion score (TPS); (F) Cycles of rh‐endostatin combined with camrelizumab and chemotherapy treatment; (G) Maintenance treatment.
