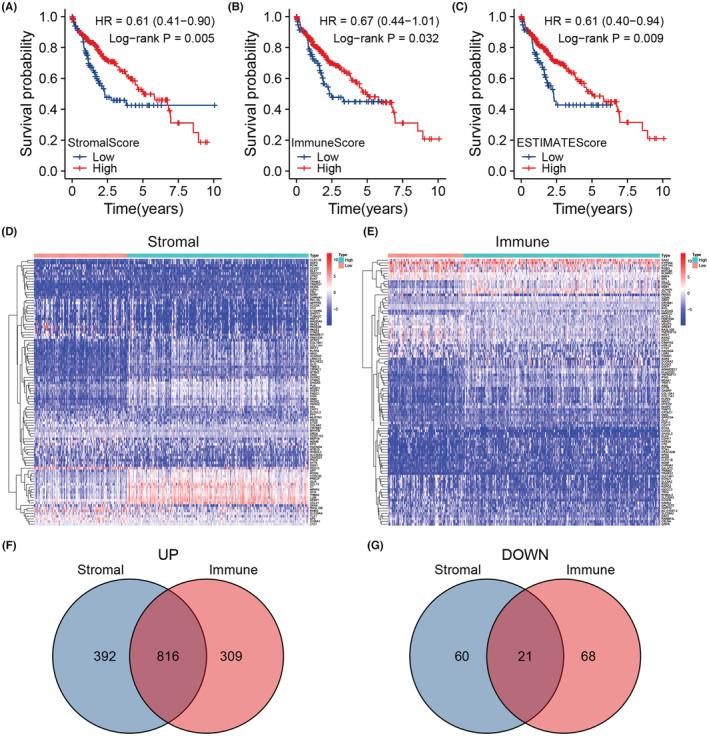
FIGURE 1.

(A) Survival analysis of high‐ and low‐stromal‐score groups based on the cut‐off −922.6 (n = 371). (B) Survival analysis of high‐ and low‐immune‐score groups based on the cut‐off 23.82 (n = 371). (C) Survival analysis of high‐ and low‐estimate‐score groups based on the cut‐off −930.5 (n = 371). (D) A heatmap displaying the DEGs between high‐ and low‐stromal‐score groups. (E) A heatmap displaying the DEGs between high‐ and low‐immune‐score groups. (F) A venn diagram showing genes that were upregulated in high‐stromal and high‐immune score groups. (G) A venn diagram showing genes that were downregulated in high‐stromal and high‐immune score groups.
