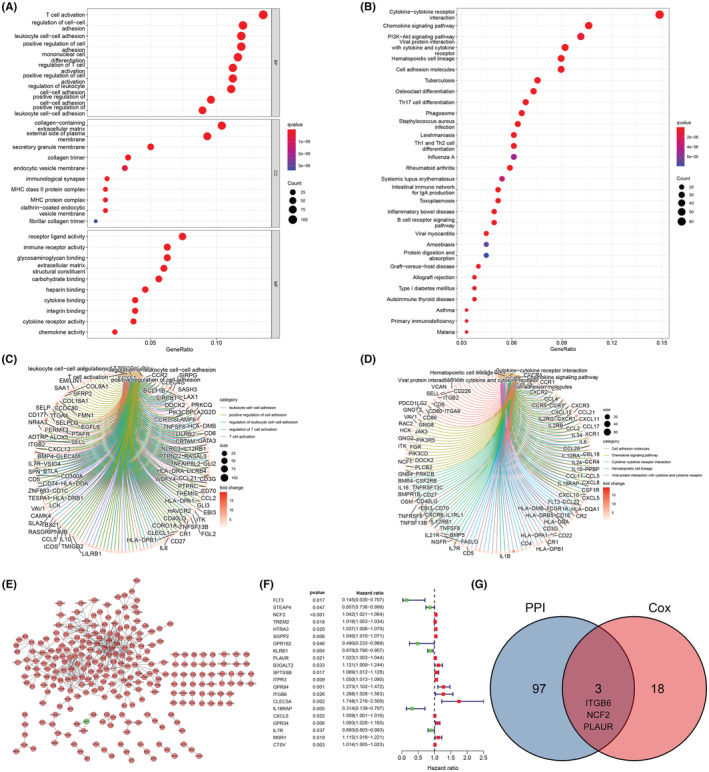
FIGURE 2.

(A) Bubble plot and (C) circle plot of GO analysis, showing the molecular functions of DEGs. (B) Bubble plot and (D) circle plot of KEGG analysis, showing the relevant pathways of DEGs. (E) PPI network showing the interaction of DEGs. (F) Univariate Cox regression analysis of DEGs (n = 371). (G) Venn diagram providing three common genes (ITGB6, NCF2, PLAUR) of the results of PPI and Cox regression analysis.
