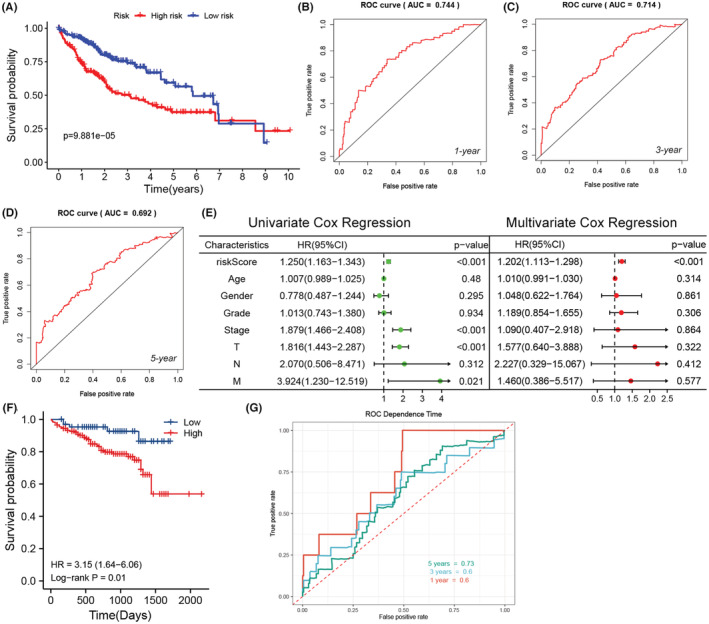
FIGURE 3.

(A) Survival analysis based on the riskScore (n = 371). (B–D) 1‐year, 3‐year, 5‐year ROC of the prognostic model. (E) Univariate and multivariate Cox Regression analysis of riskScore and other characteristics (n = 235). (F) The survival analysis of LIRI‐JP dataset in ICGC database based on the prognostic model. (G) The ROC of LIRI‐JP dataset in ICGC database based on the prognostic model.
