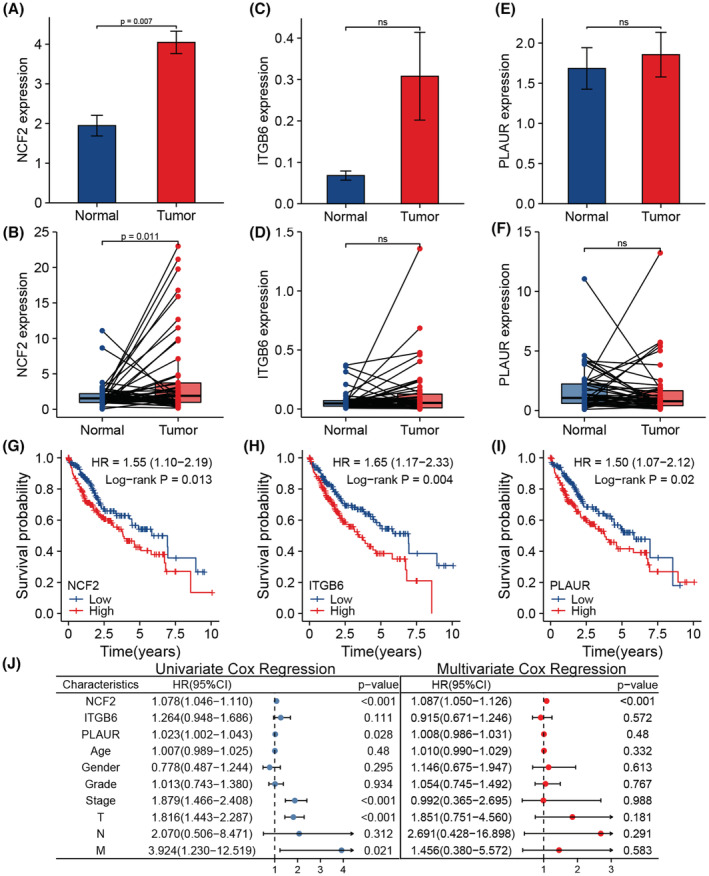
FIGURE 4.

(A) Differential expression of NCF2 between unpaired tumor and normal tissue. (B) Differential expression of NCF2 between paired tumor and normal tissue. (C) Differential expression of ITGB6 between unpaired tumor and normal tissue. (D) Differential expression of ITGB6 between paired tumor and normal tissue. (E) Differential expression of PLAUR between unpaired tumor and normal tissue. (F) Differential expression of PLAUR between paired tumor and normal tissue. (G) Result of survival analysis based on NCF2 expression level of the TCGA cohort (n = 371). (H) Result of survival analysis based on ITGB6 expression level of the TCGA cohort (n = 371). (I) Result of survival analysis based on PLAUR expression level of the TCGA cohort (n = 371). (J) Result of univariate and multivariate Cox regression analysis of the TCGA cohort (n = 235).
