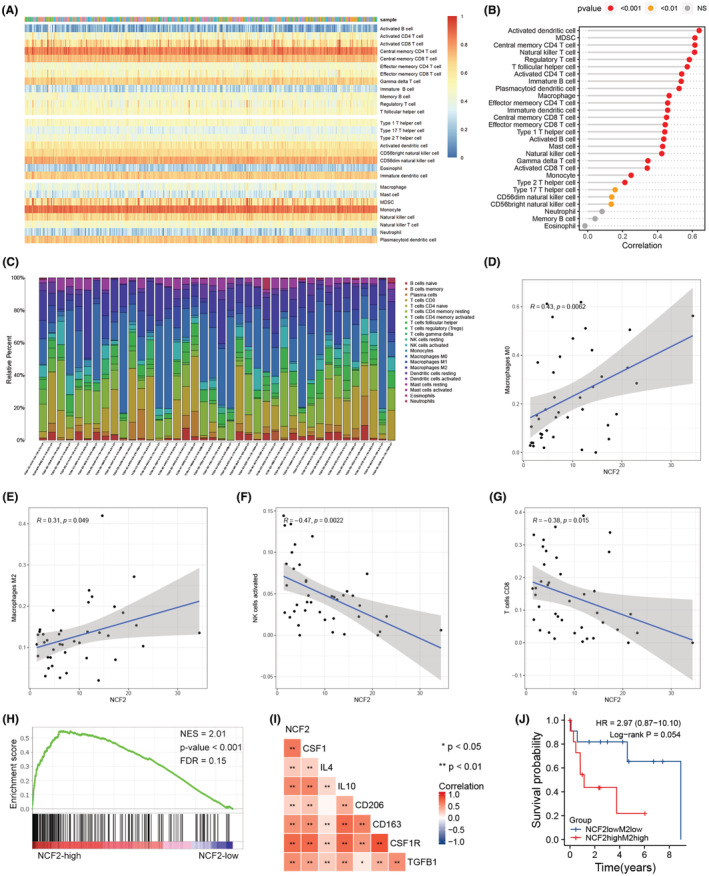
FIGURE 6.

(A) A heatmap showing the immune cells infiltration assessed by ssGSEA algorithm. (B) The correlation between NCF2 expression level and each types of immune cells infiltrating in HCC tissue based on ssGSEA result. (C) A bar plot showing the immune cells infiltration assessed by CIBERSORT algorithm. (D) Positive correlation between M0 macrophages and NCF2 expression based on CIBERSORT result. (E) Positive correlation between M2 macrophages and NCF2 expression based on CIBERSORT result. (F) Negative correlation between activated NK cells and NCF2 expression based on CIBERSORT result. (G) Negative correlation between CD8+ T cells and NCF2 expression based on CIBERSORT result. (H) GSEA of chemokine signaling pathway induced by higher NCF2 expression level. (I) Correlation among NCF2, CSF1, IL4, IL10, CD206, CD163, CSF1R and TGFβ1 expression level. (J) Survival analysis of different NCF2 expression and M2 macrophages infiltration groups.
