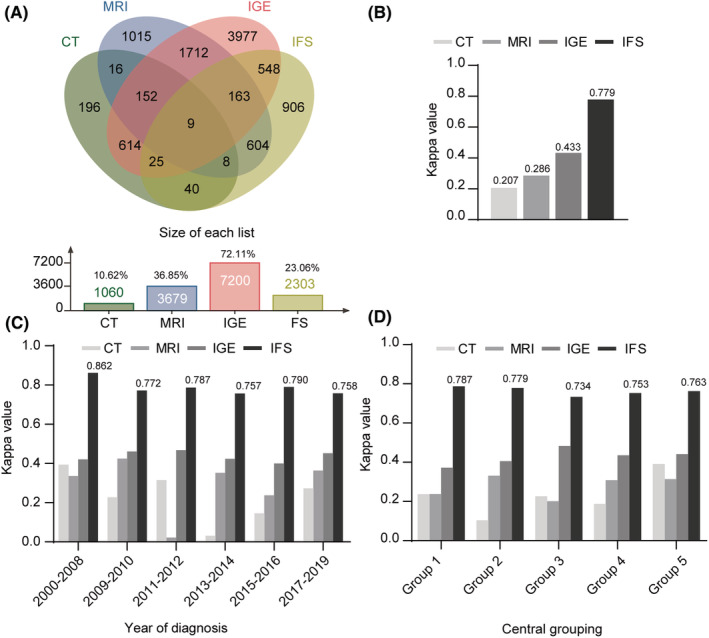
FIGURE 2.

Graphic representation of the utility differences in detecting deep myometrial invasion between CT, MRI, IGE, and IFS. (A) Wayne chart representation of different methods (CT, MRI, IGE, and IFS). (B) Histogram representation of the differences in diagnosis efficacy (Kappa values) between CT, MRI, IGE, and IFS. (C) Stratified consistency analyses based on the diagnosis year. (D) Consistency analyses grouped by medical centers.
