FIGURE 1.

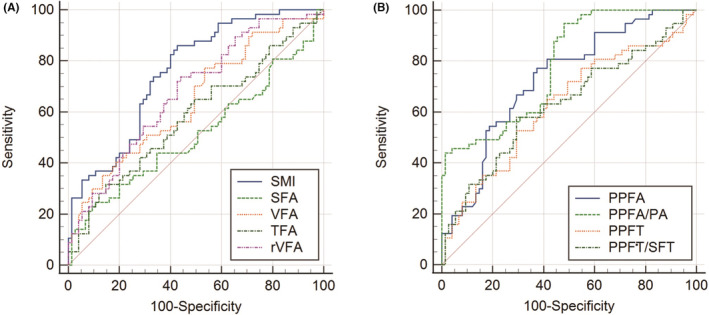
ROC curve to determine the optimal cutoff value and the predictive ability of abdominal muscle and adipose characteristics (A), and periprostatic fat parameters (B).

ROC curve to determine the optimal cutoff value and the predictive ability of abdominal muscle and adipose characteristics (A), and periprostatic fat parameters (B).