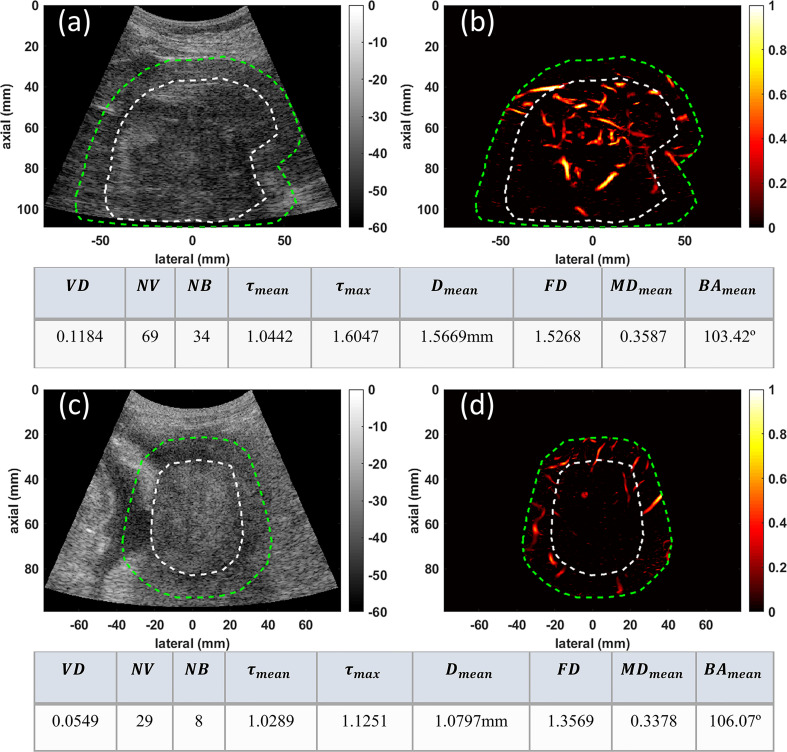
Figure 2.
Examples of visualization and quantification results for two malignant lesions. (A) B-mode image of a 94mm HCC tumor (B) Microvasculature image inside the dilated HCC tumor mask (C) B-mode image of a 51mm CCA lesion (D) Microvasculature image inside the dilated CCA tumor mask. In all images the white dashed line indicates the boundaries of the lesion, and the green dashed line delineates the boundaries after a 10mm dilation. The tables below each row of images show metric values for the HCC (top) and CCA (bottom) tumors.

