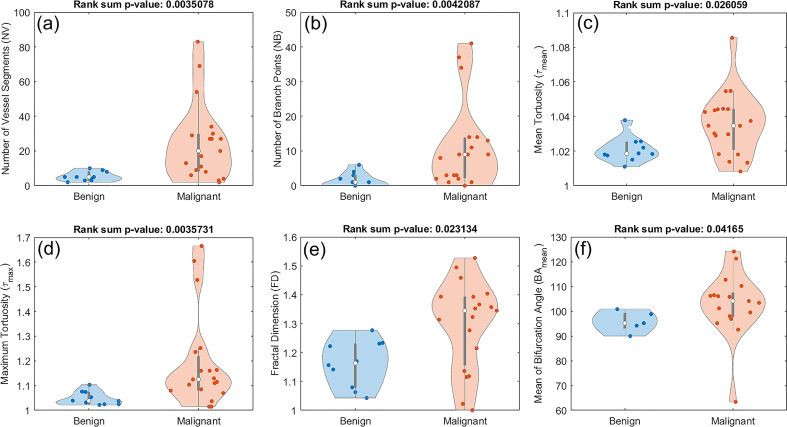
Figure 5.
Composite boxplot/violin plots of distributions of features that exhibited statistically significant difference between benign and malignant lesions. (A) Number of vessel segments (NV) (B) Number of branch points (NB) (C) Mean tortuosity (τmean ) (D) Maximum tortuosity (τmax). (E) Fractal dimension (FD) (F) Mean of bifurcation angle (BAmean).

