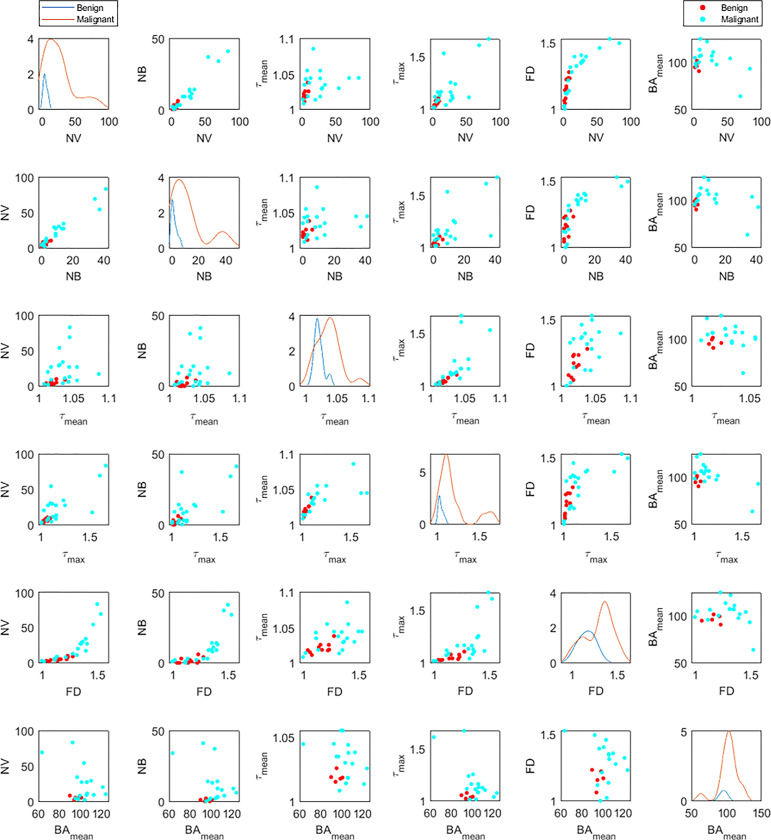
Figure 6.
Distribution densities (diagonal) and bivariate scatterplots (off-diagonal) among statistically significant morphological variables for benign and malignant lesions. Variables include number of vessel segments (NV), number of branch points (NB), mean tortuosity (τmean ), maximum tortuosity (τmax ), fractal dimension (FD), and mean of bifurcation angle (BAmean ). For each distribution graph (diagonal figures), the orange line corresponds to the malignant lesions and the blue to the benign ones. In the off-diagonal scatterplots, the red dots correspond to the malignant lesions and the cyan to the benign ones.

