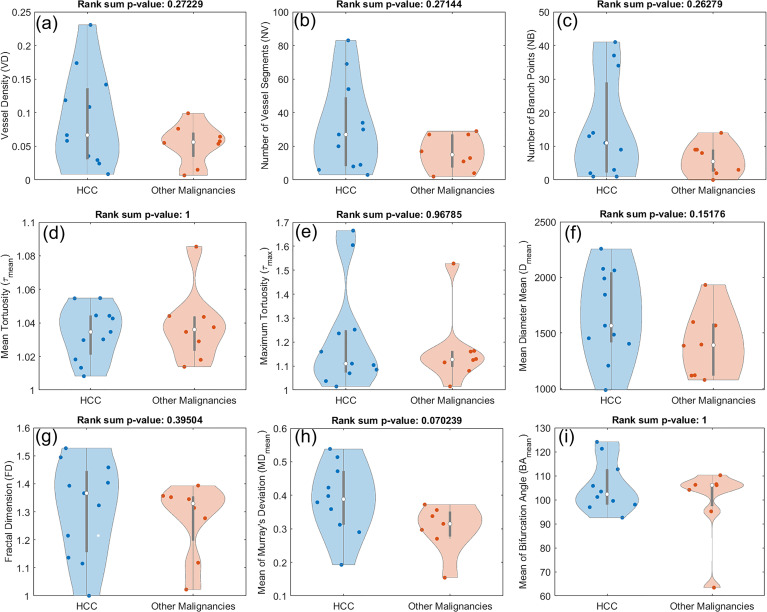
Figure 8.
Composite boxplot/violin plots for all the utilized features in this study, comparing HCC with other malignant hepatic lesions (CCA and metastatic adenocarcinoma). None of the metrics proved distinctive between the two groups. (A) Vessel density (VD) (B) Number of vessel segments (NV) (B) Number of branch points (NB) (D) Mean tortuosity (τmean ) (E) Maximum tortuosity (τmax ) (F) Mean of mean diameter (Dmean ) (G) Fractal dimension (FD) (H) Mean of Murray’s deviation (MDmean ) (I) Mean of bifurcation angle (BAmean ).

