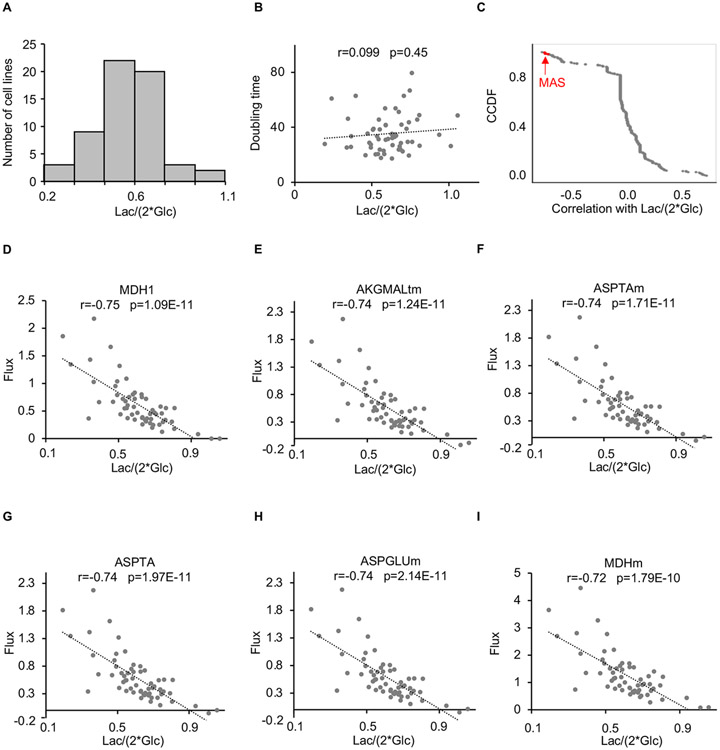
Figure 1: Lactate excretion is correlated with malate-aspartate shuttle flux, but not proliferation in cancer cells.
(A) Histogram showing the distribution of lactate-excretion rates across the NCI-60 panel of cell lines.
(B) No significant correlation was observed between lactate-excretion rate and doubling times for cancer cell lines from the NCI-60 panel. A correlation coefficient (r) and a p value as determined by a Pearson correlation are provided.
(C) Complementary cumulative distribution function (CCDF) for Pearson correlations between metabolic fluxes and the lactate-excretion rate for cancer cell lines from the NCI-60 panel. Fluxes highlighted in red correspond to reactions involved in the malate-aspartate shuttle. We note that the glycerol 3-phosphate shuttle was not included in the metabolic model used for flux balance analysis.
(D-I) Plot of malate-aspartate shuttle fluxes as a function of lactate-excretion rate for cancer cell lines from the NCI-60 panel. Correlation coefficients (r) and p values as determined by a Pearson correlation are provided.
Results are from the analysis of the NCI-60 panel of cancer cell lines. Lac, lactate; Glc, glucose.

