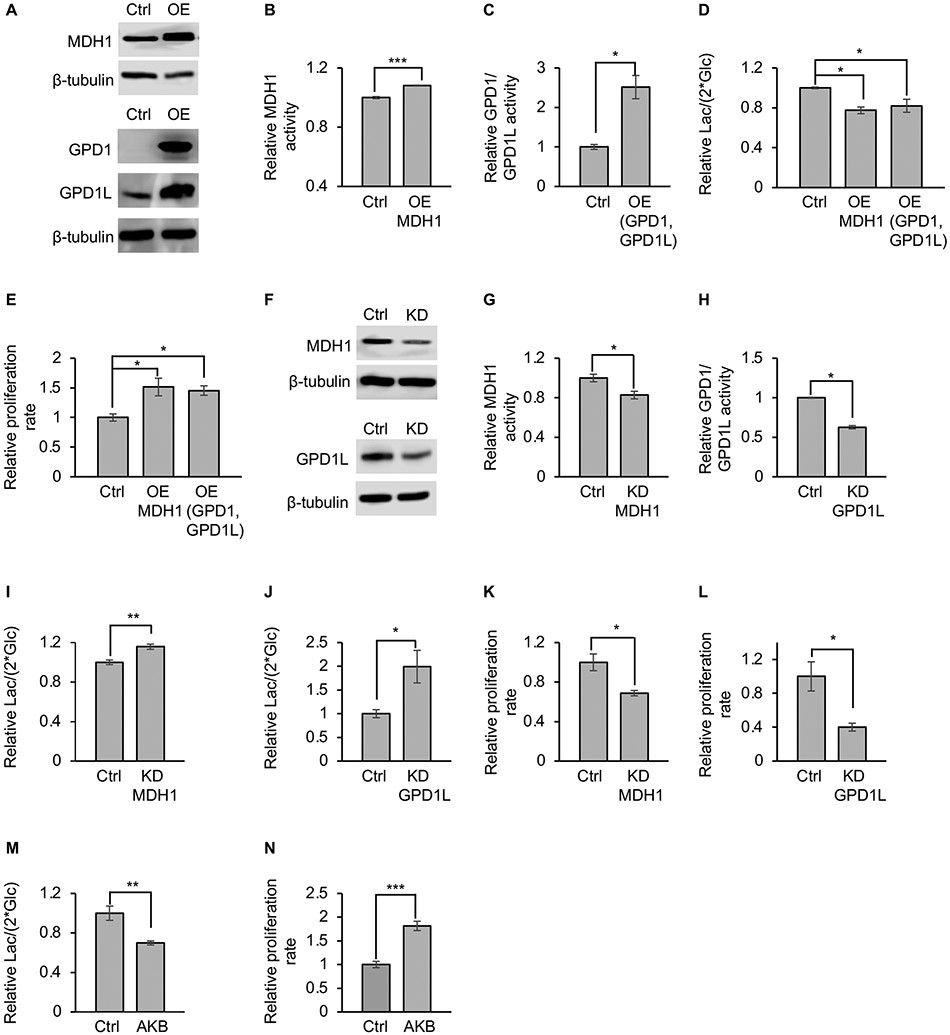
Figure 2: MDH1 activity and GPD1/GPD1L activity regulate lactate-excretion rate.
(A) Western blots for MDH1, GPD1, and GPD1L in PC3 cancer cells. Overexpression increases protein levels. Control cells overexpressed green fluorescent protein (GFP) instead of a dehydrogenase.
(B and C) Overexpressing MDH1 (B), GPD1, and GPD1L (C) in PC3 cancer cells increases MDH1 and GPD1/GPD1L activities. Control cells overexpressed GFP instead of a dehydrogenase. MDH1 activities was determined by the fraction of [2-2H] malate normalized to the fraction of [1-2H] GAP. GPD1/GPD1L activities was determined by the fraction of [1,2-2H] G3P normalized to the fraction of [1-2H] DHAP and [4-2H] NADH. n=3 replicates per group. p values were determined by using a two-tailed Student’s t test.
(D) Lactate-excretion rates decrease when MDH1 or GPD1/GPD1L are overexpressed. n=3 replicates per experimental group. p values were determined by using a one-way analysis of variance (ANOVA) followed by Dunnett’s test.
(E) Proliferation rate of PC3 cells before and after overexpression of MDH1 or GPD1/GPD1L. n=3 replicates per experimental group. p values were determined by using a one-way ANOVA followed by Dunnett’s test.
(F) Western blots for MDH1 and GPD1L in PC3 cells after MDH1 or GPD1L knockdown. GPD1 is not shown because its levels were below detection prior to knockdown.
(G and H) Knocking down MDH1 (G) or GPD1L (H) in PC3 cells decreases MDH1 and GPD1/GPD1L activities. MDH1 and GPD1/GPD1L activities were determined as in (B) and (C).
(I and J) Lactate-excretion rates in PC3 cells are increased after MDH1 (I) or GPD1L (J) knockdown. Control cells were administered scrambled siRNA. n=9 replicates per experimental group for panel (I). n=10 replicates per experimental group for panel (J). p values were determined by using a two-tailed Student’s t test.
(K and L) Proliferation rate of PC3 cells decreases when MDH1(K) and GPD1L (L) is knocked down. n=3 replicates per experimental group. p values were determined by using a two-tailed Student’s t test.
(M) Lactate-excretion rate decreases when PC3 cells are given 0.5 mM AKB. n=3 replicates per experimental group. p values were determined by using a two-tailed Student’s t test.
(N) Proliferation rate increases when PC3 cells are given 0.5 mM AKB. n=3 replicates per experimental group. p values were determined by using a two-tailed Student’s t test.
Error bars denote standard error. *p≤0.05, **p≤0.001, ***p≤0.001, n.s.>0.05 Ctrl, control; OE, overexpression; KD, knockdown; Lac, lactate; Glc, glucose; GAP, glyceraldehyde 3-phosphate; G3P, glycerol 3-phosphate; DHAP, dihydroxyacetone phosphate; AKB, alpha-ketobutyrate.

