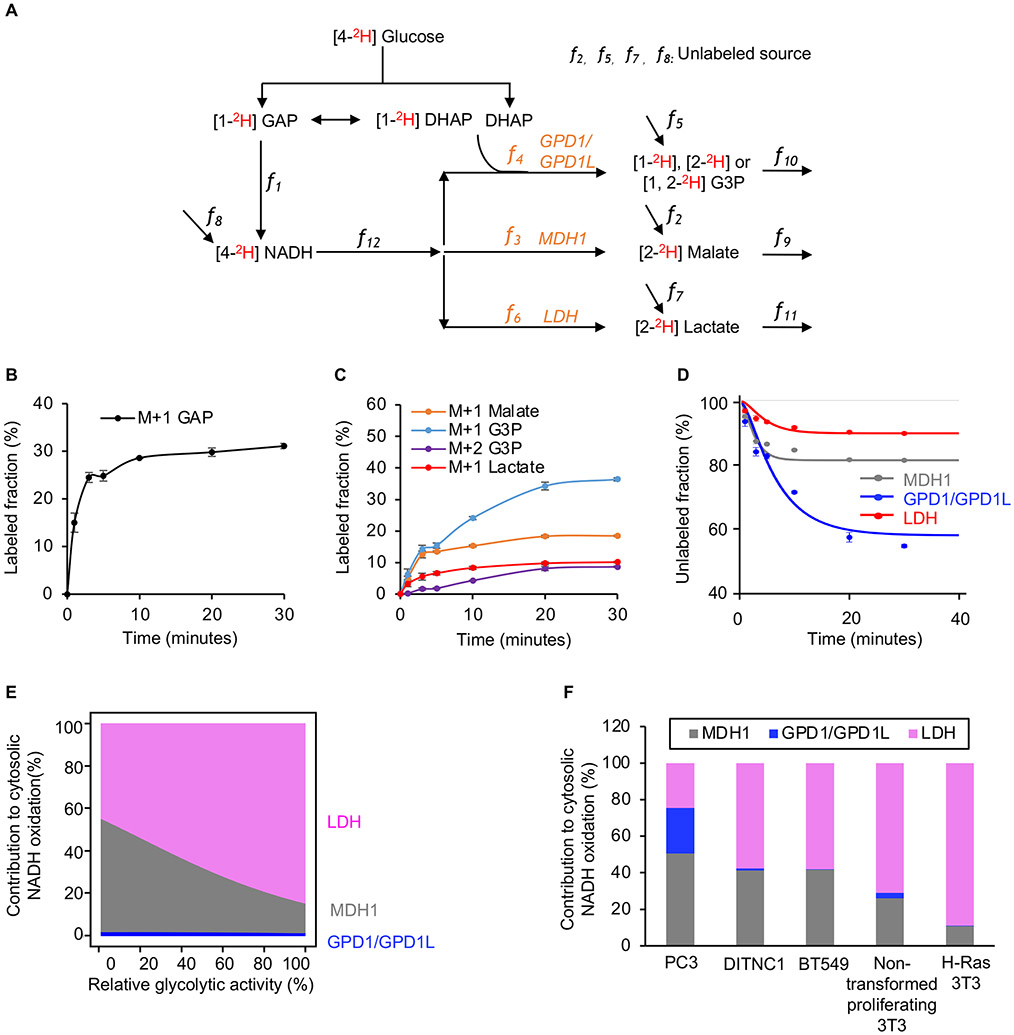
Figure 5: Absolute quantitation of NAD+ regeneration fluxes.
(A) Schematic of our model used to calculate fluxes from [4-2H] glucose labeling.
(B) Fraction of labeled GAP in H-Ras 3T3 cells as a function of time after introducing [4-2H] glucose. n=3 replicates per time point.
(C) Fraction of labeled M+1 G3P, labeled M+2 G3P, labeled M+1 malate, and labeled M+1 lactate in H-Ras 3T3 cells as a function of time after introducing [4-2H] glucose. n=3 replicates per time point.
(D) Fraction of unlabeled malate, G3P, and lactate in H-Ras 3T3 cells as a function of time after introducing [4-2H] glucose. The measured metabolite concentrations, the rate of glucose consumption, the rate of lactate excretion, and Equations 1, 2, 3, and 4 were used to find the best model fit from which the activities of MDH1, GPD1/GPD1L, and LDH were determined. n=3 replicates per experimental group.
(E) Proportion of glycolysis-derived NADH oxidized by MDH1, GPD1/GPD1L, and LDH in H-Ras 3T3 cells as a function of glycolytic activity. Calculations were based on the fitted curve shown in Figure S6B.
(F) Proportion of glycolysis-derived NADH oxidized by MDH1, GPD1/GPD1L, and LDH in multiple cell lines. Actual flux values of MDH1, GPD1/GPD1L, and LDH were determined by the measured metabolite concentrations, the rate of glucose consumption, the rate of lactate excretion, and Equations 1, 2, 3, and 4.
Error bars denote standard error.
GAP, glyceraldehyde 3-phosphate; G3P, glycerol 3-phosphate; DHAP, dihydroxyacetone phosphate.

