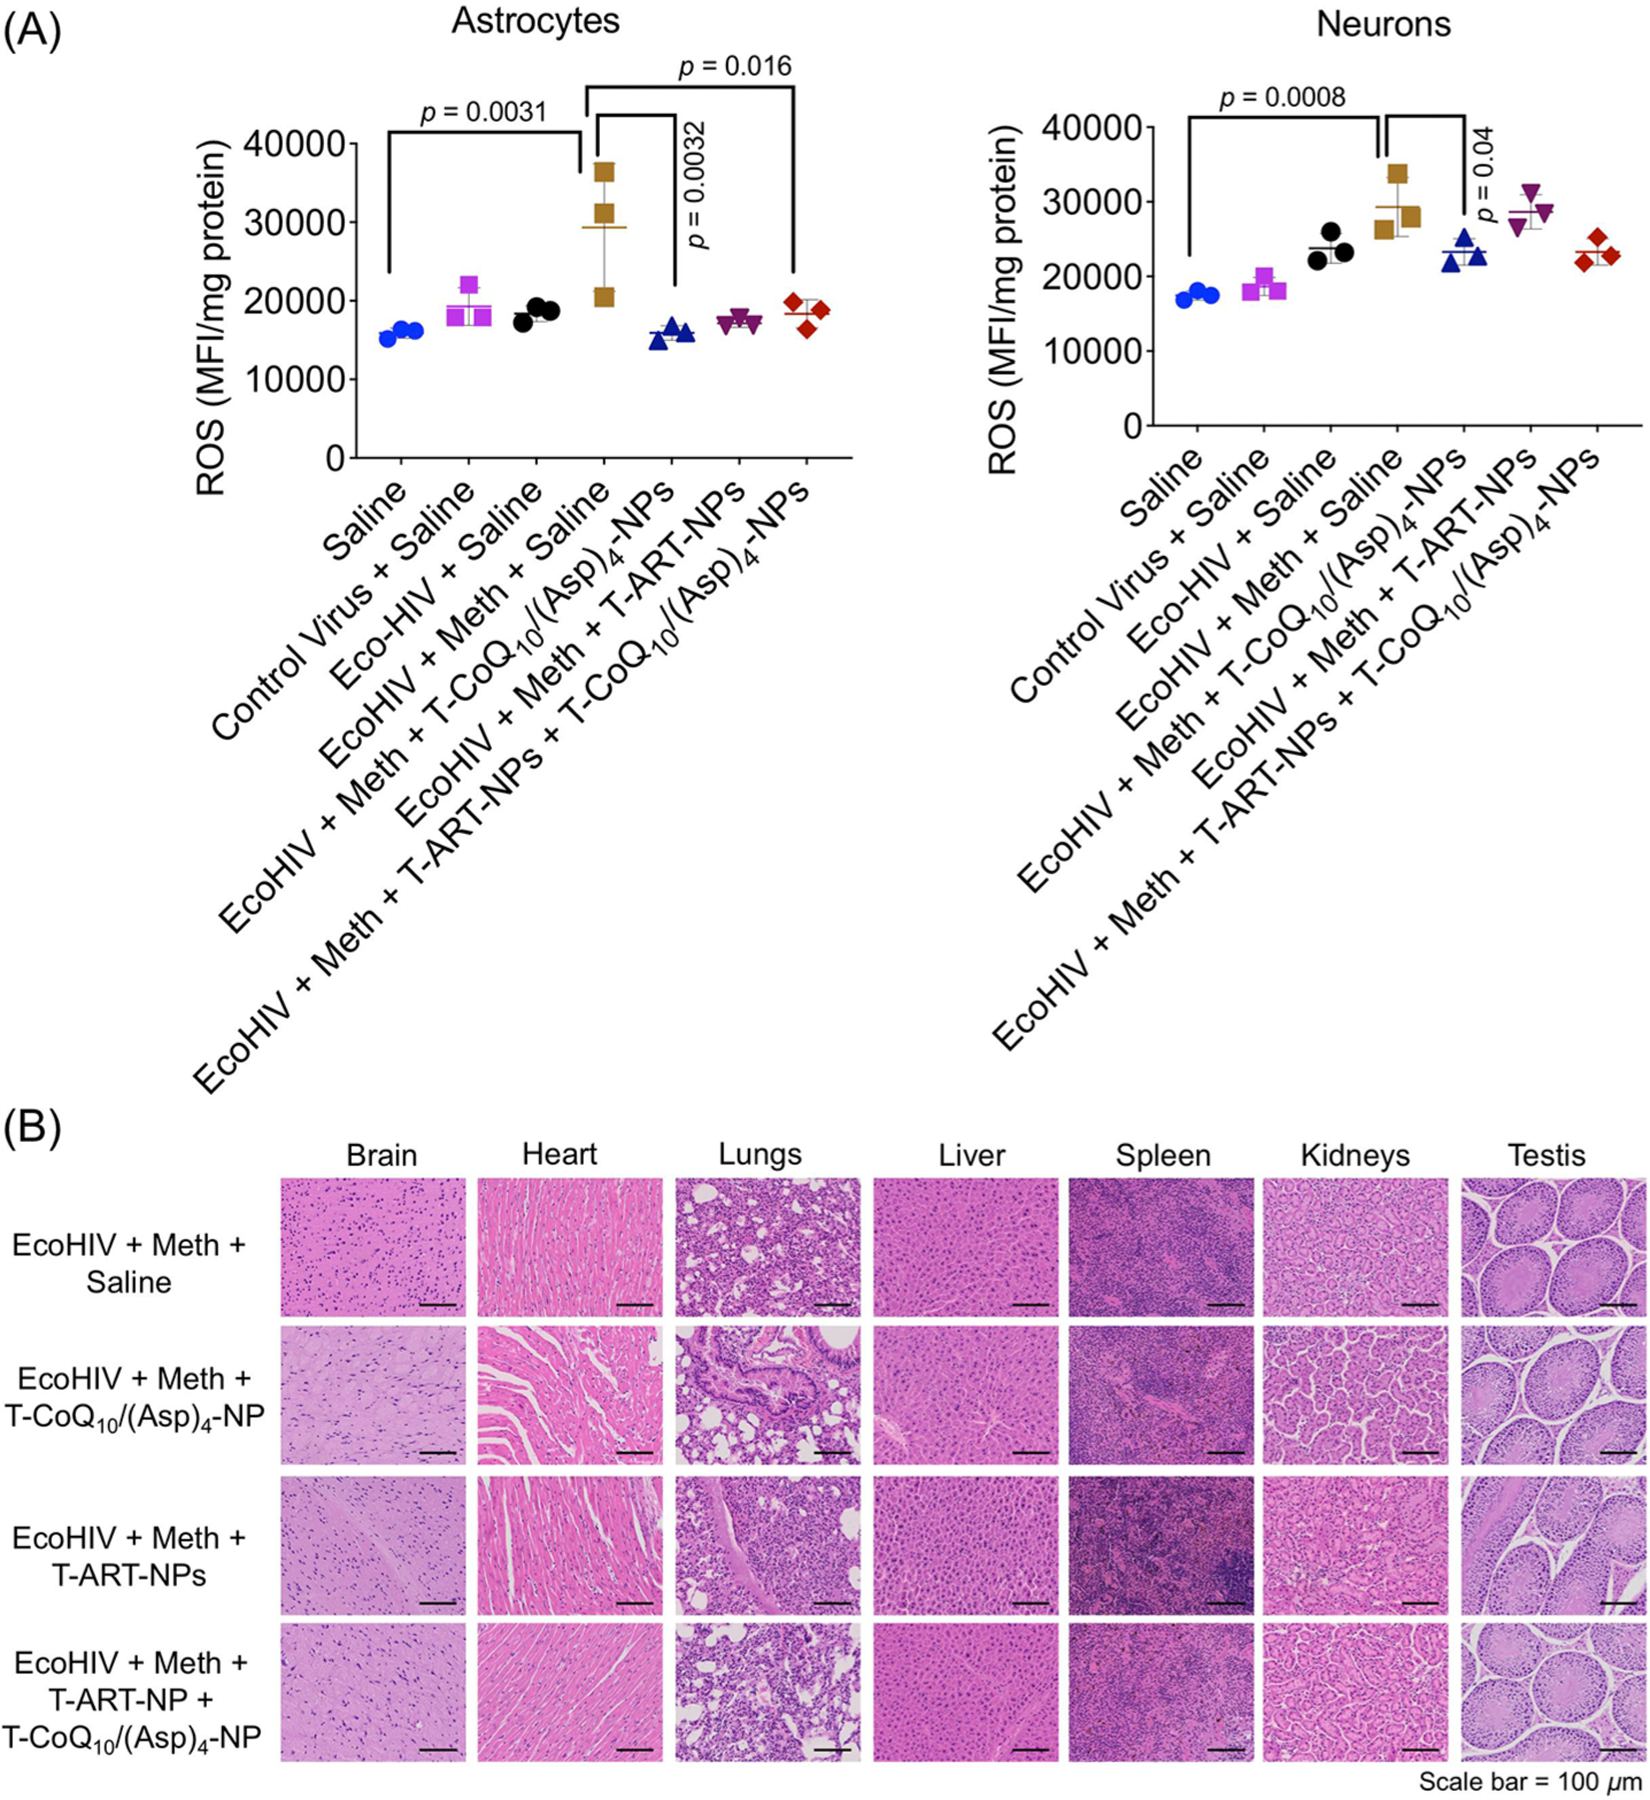
Figure 9.

(A) ROS levels in isolated astrocytes and neurons from treated mice brain. (B) H&E images of all the tissue sections after the treatment (scale bar = 50 μm). C57BL/6 male mice were divided into 12 groups and were assigned to the following treatment groups: control virus + meth + saline (12 animals); control virus + saline (12 animals); control virus + meth + T-CoQ10-NP/T-(Asp)4-NP (13 animals); EcoHIV + meth + saline (11 animals); EcoHIV + meth + T-CoQ10-NP/T-(Asp)4-NP (10 animals); EcoHIV + meth + T-ART-NPs (12 animals); EcoHIV + meth + T-ART-NP + T-CoQ10-NP/T-(Asp)4-NP (16 animals); control virus + meth + T-CoQ10/(Asp)4-NPs (11 animals); control virus + T-ART-NPs (13 animals); control Virus + T-ART-NPs + T-CoQ10/(Asp)4-NPs (12 animals), saline (3 animals), and EcoHIV + saline (3 animals). The mice were treated with either control virus (pBMN-I-GFP) or chimeric HIV-NDK (EcoHIV, 1 μg of p24), followed by one-week multiday exposure to meth (0.2 mg/kg at each injection for 5 days) and subsequent two-week treatment with T-ART-NPs (5 mg/kg with respect to the drug) and T-CoQ10/(Asp)4-NPs (20 mg/kg with respect to the drug) via an intravenous route
