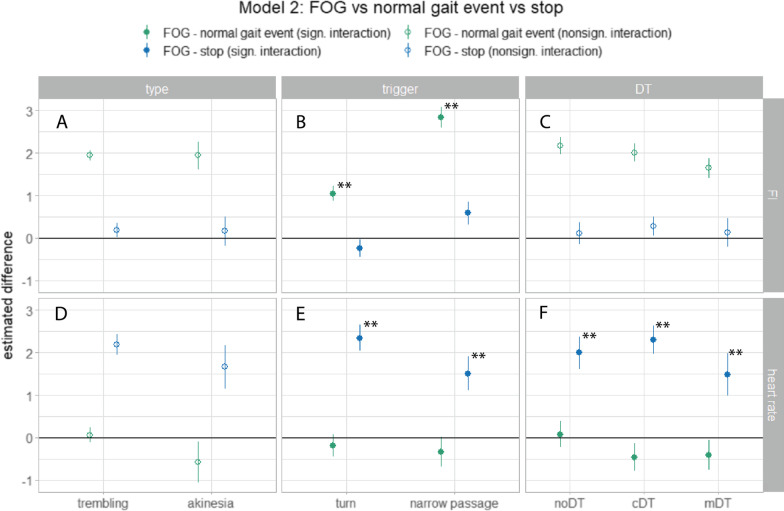
Fig. 5.
Results of the post-hoc analyses of the linear mixed-model analysis of the second model comparing the FI (A–C) (model 2.a), and heart rate change (D–F) (model 2.b) for the differences between FOG and a normal gait event (green), and FOG and stopping (blue). The point ranges indicate the estimated differences with standard errors of the post-hoc analyses for each FOG type (first column), FOG trigger (second column), and DT condition (third column), but the symbols are only filled when a significant interaction effect of this factor was found with condition (i.e. FOG—normal gait event or FOG—stop). This means that the panel with the hollow symbols followed the main effects of Table 2. Results of the post-hoc analysis that were significant after p-value correction are indicated with an asterisk (*, < 0.05; **, < 0.005). Figures were created with the ggplot2 package in Rstudio. (FI Freezing Index, FOG Freezing of Gait, noDT no dual-task, cDT cognitive dual-task, mDT motor dual-task)

