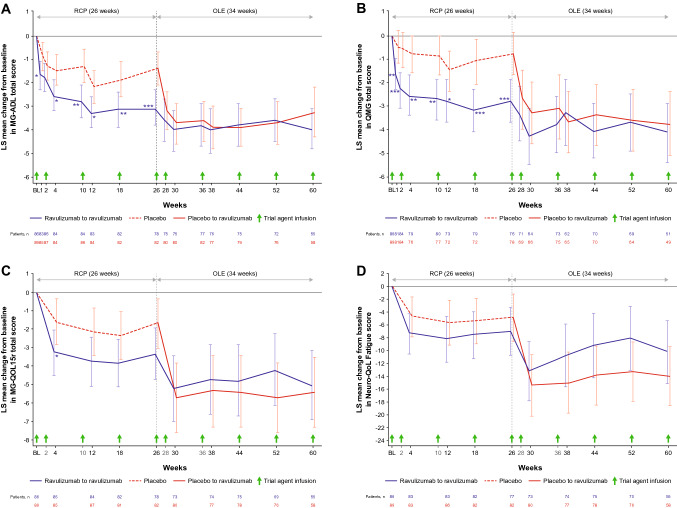
Fig. 3.
Least-squares mean change (95% CI) from RCP baseline in A MG-ADL total score, B QMG total score, C MG-QOL15r total score and D Neuro-QoL Fatigue score. *, **, and *** indicate two-sided p-values of < 0.05, < 0.01, and < 0.001, respectively, for the comparison of treatment groups in change from baseline during the RCP (p-values are nominal for comparisons at all timepoints except Week 26; endpoints at Week 26 were tested in a hierarchical manner). The RCP estimates are based on an MMRM that included treatment group, stratification factor region, baseline score, study visit, and study visit by treatment group interaction. Visits up to Week 26 were included in the model. The OLE estimates are based on an MMRM that included stratification factor region, baseline score, and study visit. A model was fit for the ravulizumab–ravulizumab and placebo–ravulizumab arms of the OLE analysis set separately. Data for the full analysis set are shown for the RCP; data for the OLE analysis set are shown for the OLE period. Data are offset for clarity. BL, baseline; CI, confidence interval; LS, least squares; MG-ADL, Myasthenia Gravis–Activities of Daily Living; MG-QOL15r, revised 15-item Myasthenia Gravis Quality of Life; MMRM, mixed model for repeated measures; Neuro-QoL, Neurological Quality of Life; OLE, open-label extension; QMG, Quantitative Myasthenia Gravis; RCP, randomized controlled period

