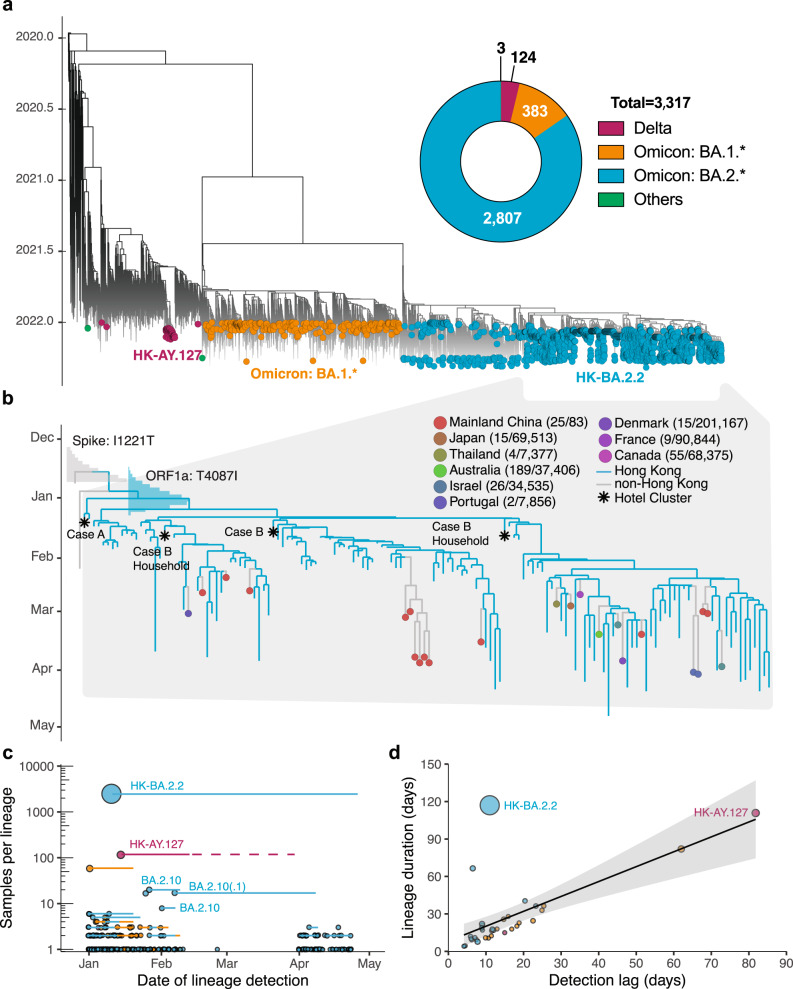
Fig. 2. Phylogenetic analysis and transmission lineages of the fifth wave outbreak from January to April 2022 in Hong Kong.
a Time-scaled ML tree of 3317 viruses sampled from Hong Kong (colored circles) on a background of 5220 subsampled global viruses collected throughout the pandemic (no tips). b Time-resolved maximum clade credibility (MCC) tree of BA.2.2 lineage (n = 121 in Hong Kong and n = 26 global sequences after subsampling; see Methods). The posterior distribution of the time to the most recent common ancestor (tMRCA) is shown in bar charts. The numbers in the brackets indicate BA.2.2 sequences for each country over the total number of sequences in GISAID (accessed 1 May 2022) from January to April 2022. c Summary of SARS-CoV-2 transmission lineages in Hong Kong. Dots represent monophyletic clades colored by lineage and proportional to sequence numbers. Horizontal lines represent the time between the first and last sample dates. After 13 February 2022, there is no AY.127 sequences available in GISAID, but an existing study found the latest AY.127 sequence (incomplete genome) in late March13, as indicated by the light red dashed line. d Correlation between the detection lag (from tMRCA to first sample date) and duration (tMRCA to last sample date). The shaded area represents the fitted values’ 95% confidence intervals.

