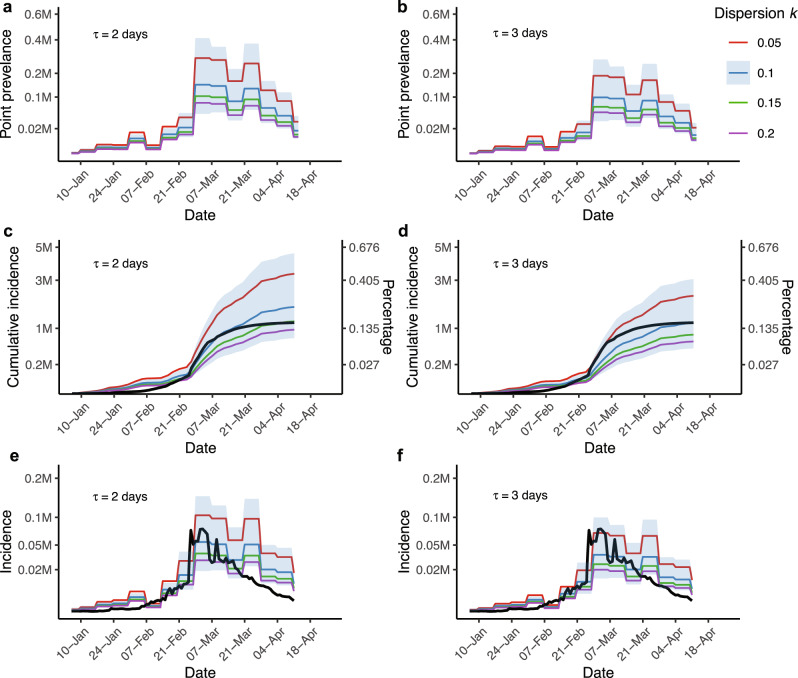
Fig. 4. Estimations of point prevalence and cumulative incidence from 6 January to 13 April.
Colored lines represent different levels of dispersion parameter k. Point prevalence, cumulative incidence, and incidence are shown at generation time τ = 2 days in a, c, and e, and at τ = 3 days in b, d, and f. The black lines in c–f are locally reported cases. Incidence and point prevalence were averaged weekly. The blue shaded area denotes the 95% confidence interval when k = 0.1. The scale for the incidence and percentage is the same in c, d.

