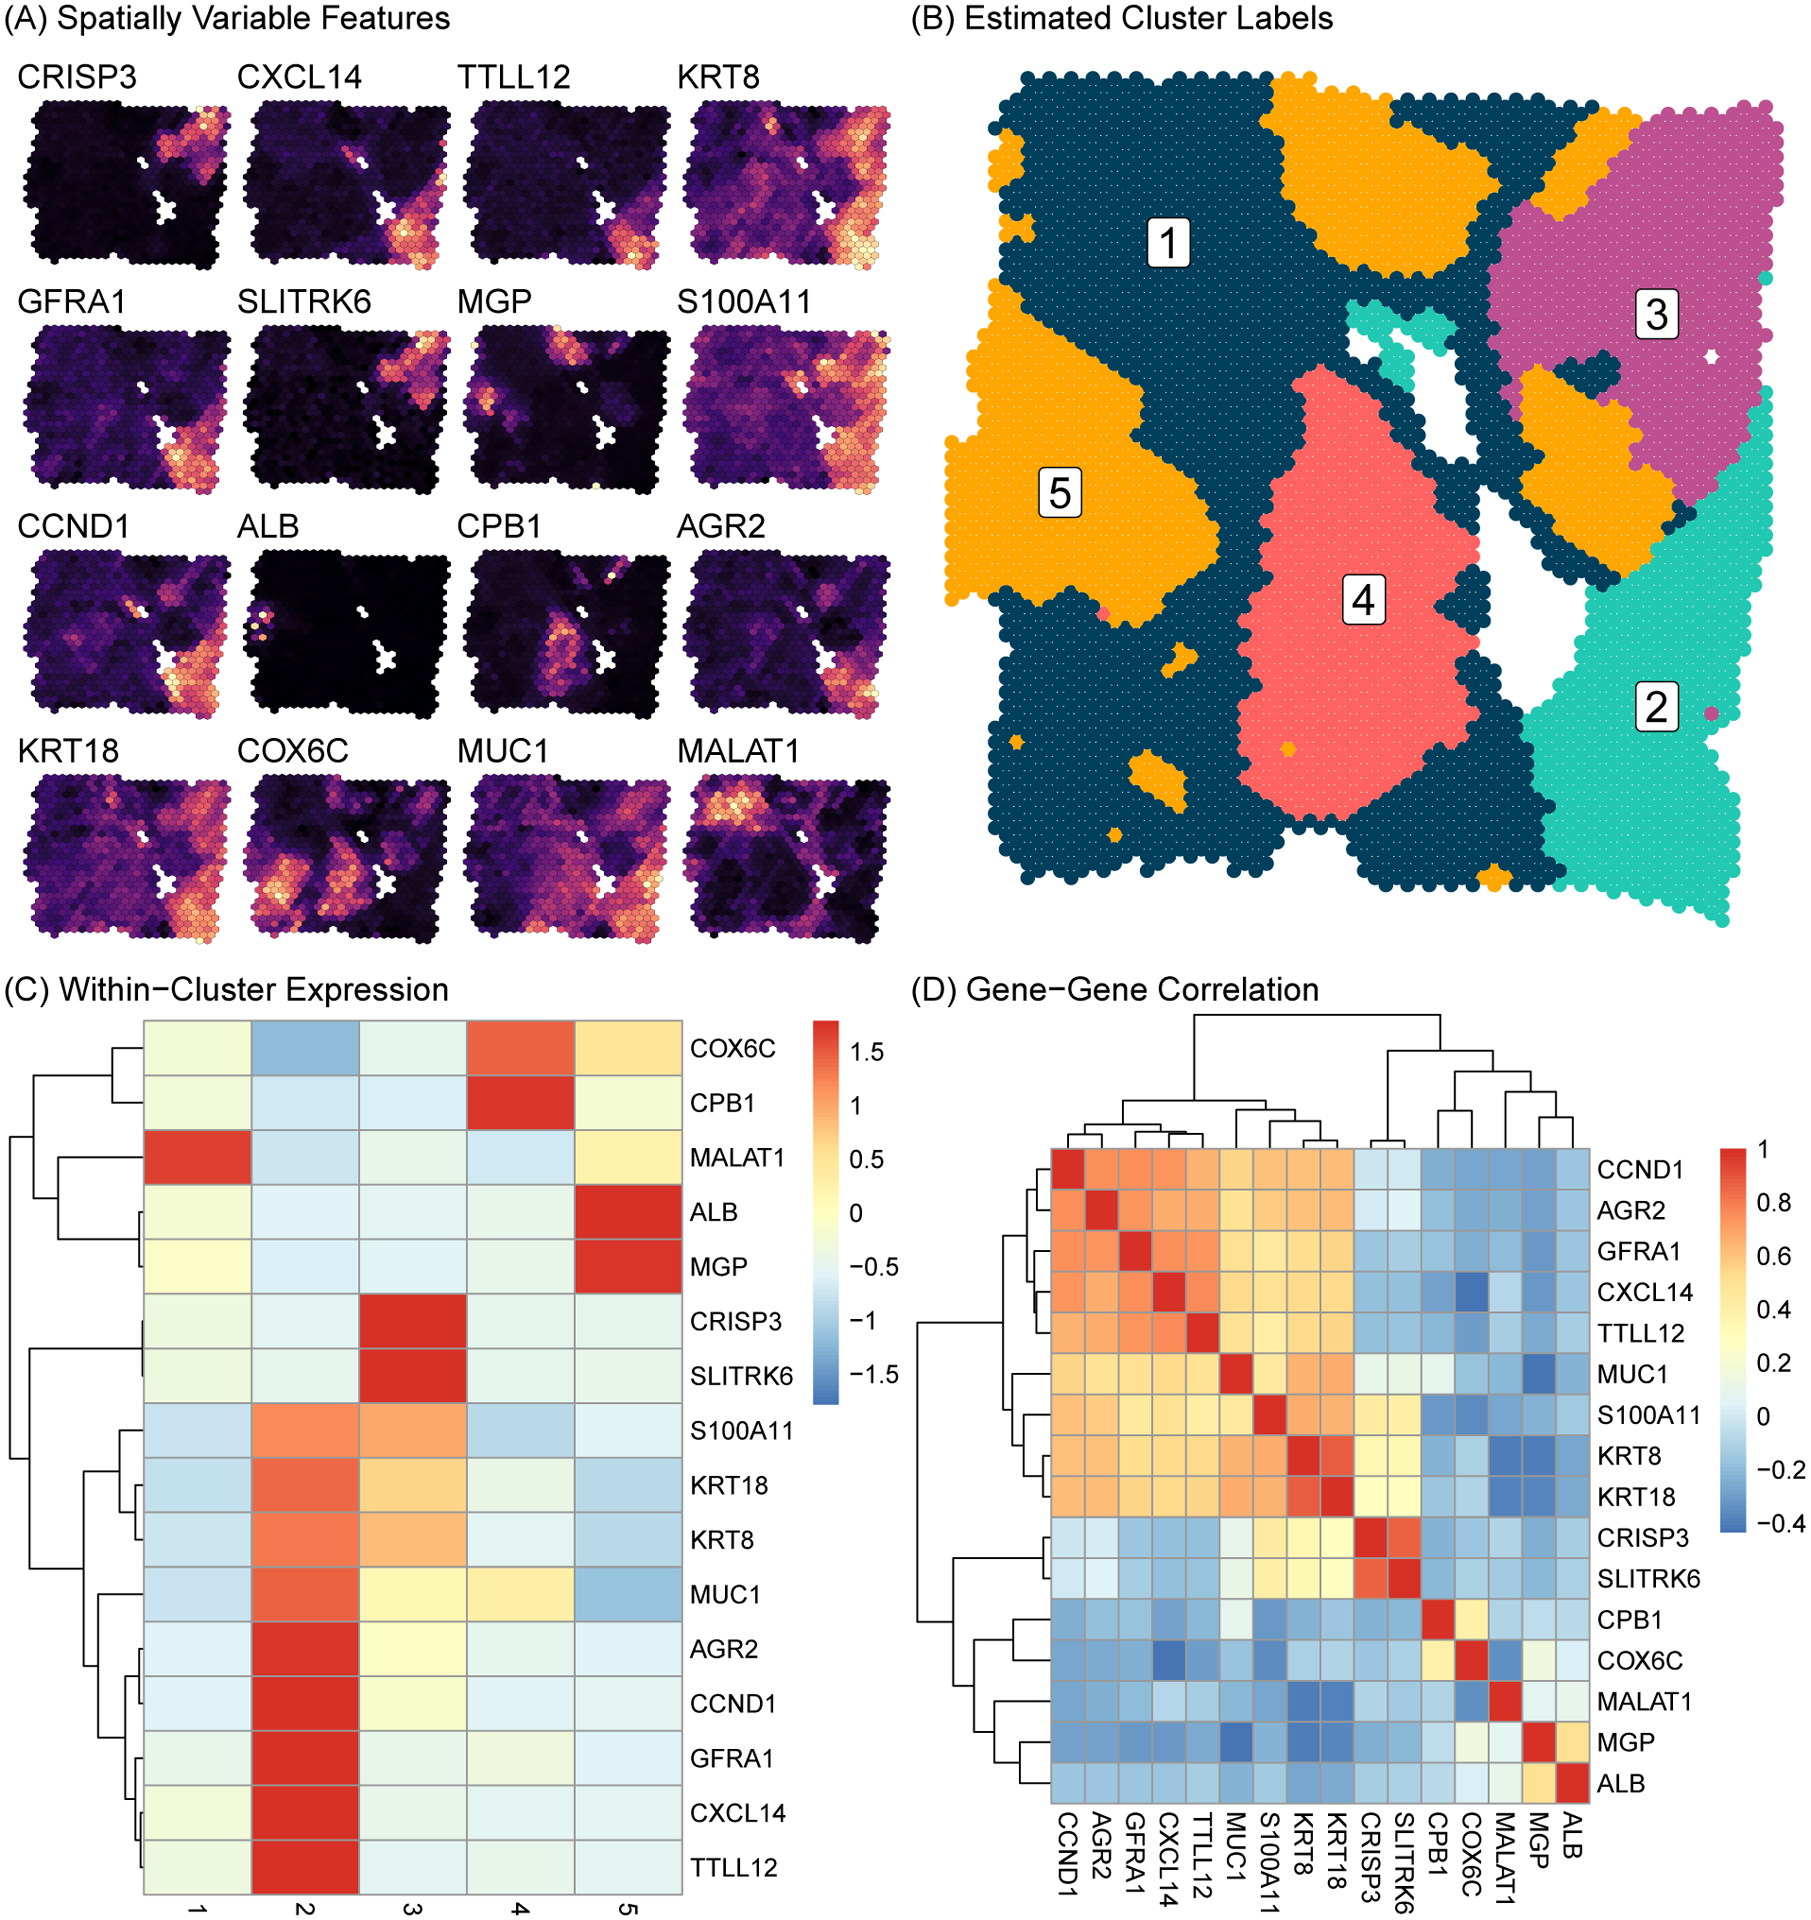
Figure 4.

Human Invasive Ductal Carcinoma breast tissue sample sequenced with the 10X Genomics Visium platform. (A) Expression intensity of the top 16 top SVGs is shown across the tissue (brighter color implies higher expression). (B) Inferred sub-population labels from SPRUCE. (C) Heatmap of mean gene expression profiles within sub-populations. (D) Heatmap of gene-gene correlations.
