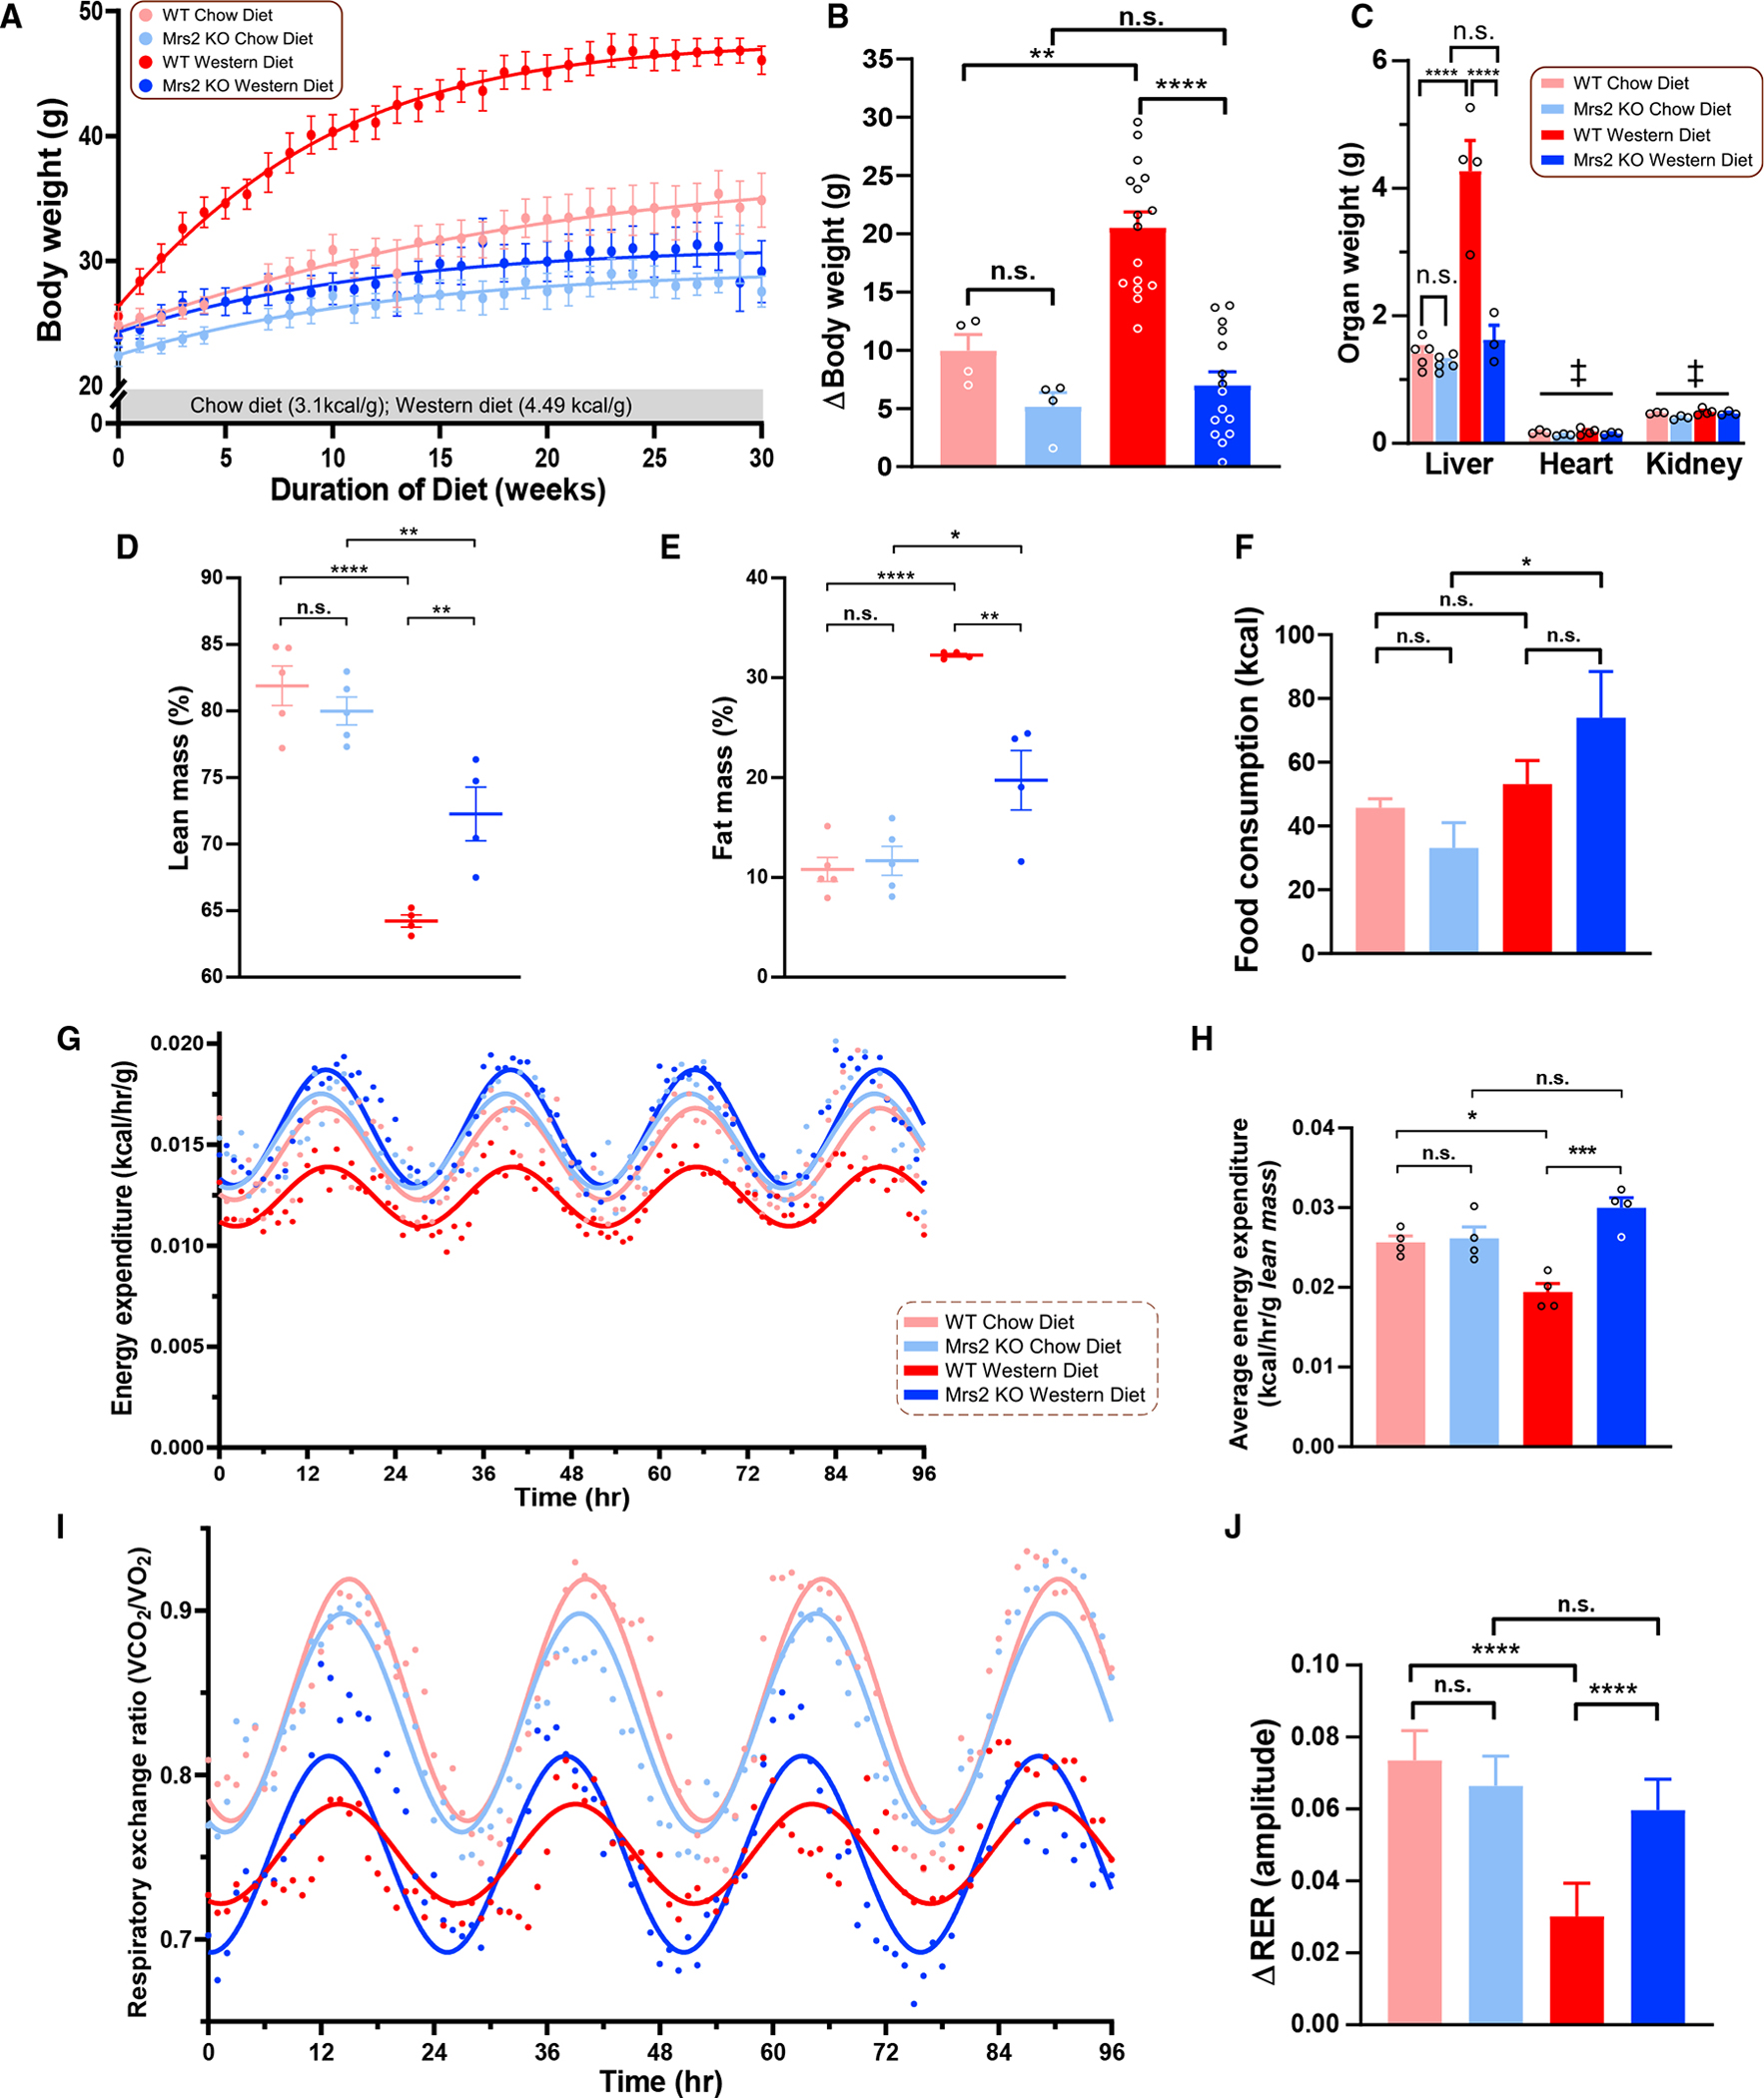
Figure 1. Blocking mitochondrial Mg2+ uptake prevents diet-induced obesity.

(A) Body weight change over a 30-week diet period. Data fit with a Gompertz growth curve (n = 4–16 mice/group).
(B) Weight gained during the dietary regimen.
(C) Liver, heart, and kidney weights after 1 year diet period. ‡ = Not significant, multiple comparisons are done the same as the liver. n = 3–4 mice (organs) per group.
(D and E) Percent lean mass (D) and fat mass (E) of indicated groups. n = 3–4 mice.
(F) Measurement of food intake of 1 year CD- or WD-fed mice during indirect calorimetry with Promethion system.
(G) Energy expenditure of CD- or WD-fed (1 year) WT or Mrs2−/− mice. Data fit with a fixed-frequency sinusoidal equation y = B + A sin(0.25x + ϕ). n = 4–5 mice.
(H) Lean mass-normalized energy expenditure data derived from (G).
(I) Respiratory exchange ratio (RER) of CD- or WD-fed (1 year) WT or Mrs2−/− mice. Data fit with a fixed-frequency sinusoidal equation y = B + A sin(0.25x+ϕ). n = 4–5 mice.
(J) The change in RER from light to dark cycle. All data shown as mean ± SEM; ****p < 0.0001, ***p < 0.001, **p < 0.01, *p < 0.05, n.s. = not significant.
