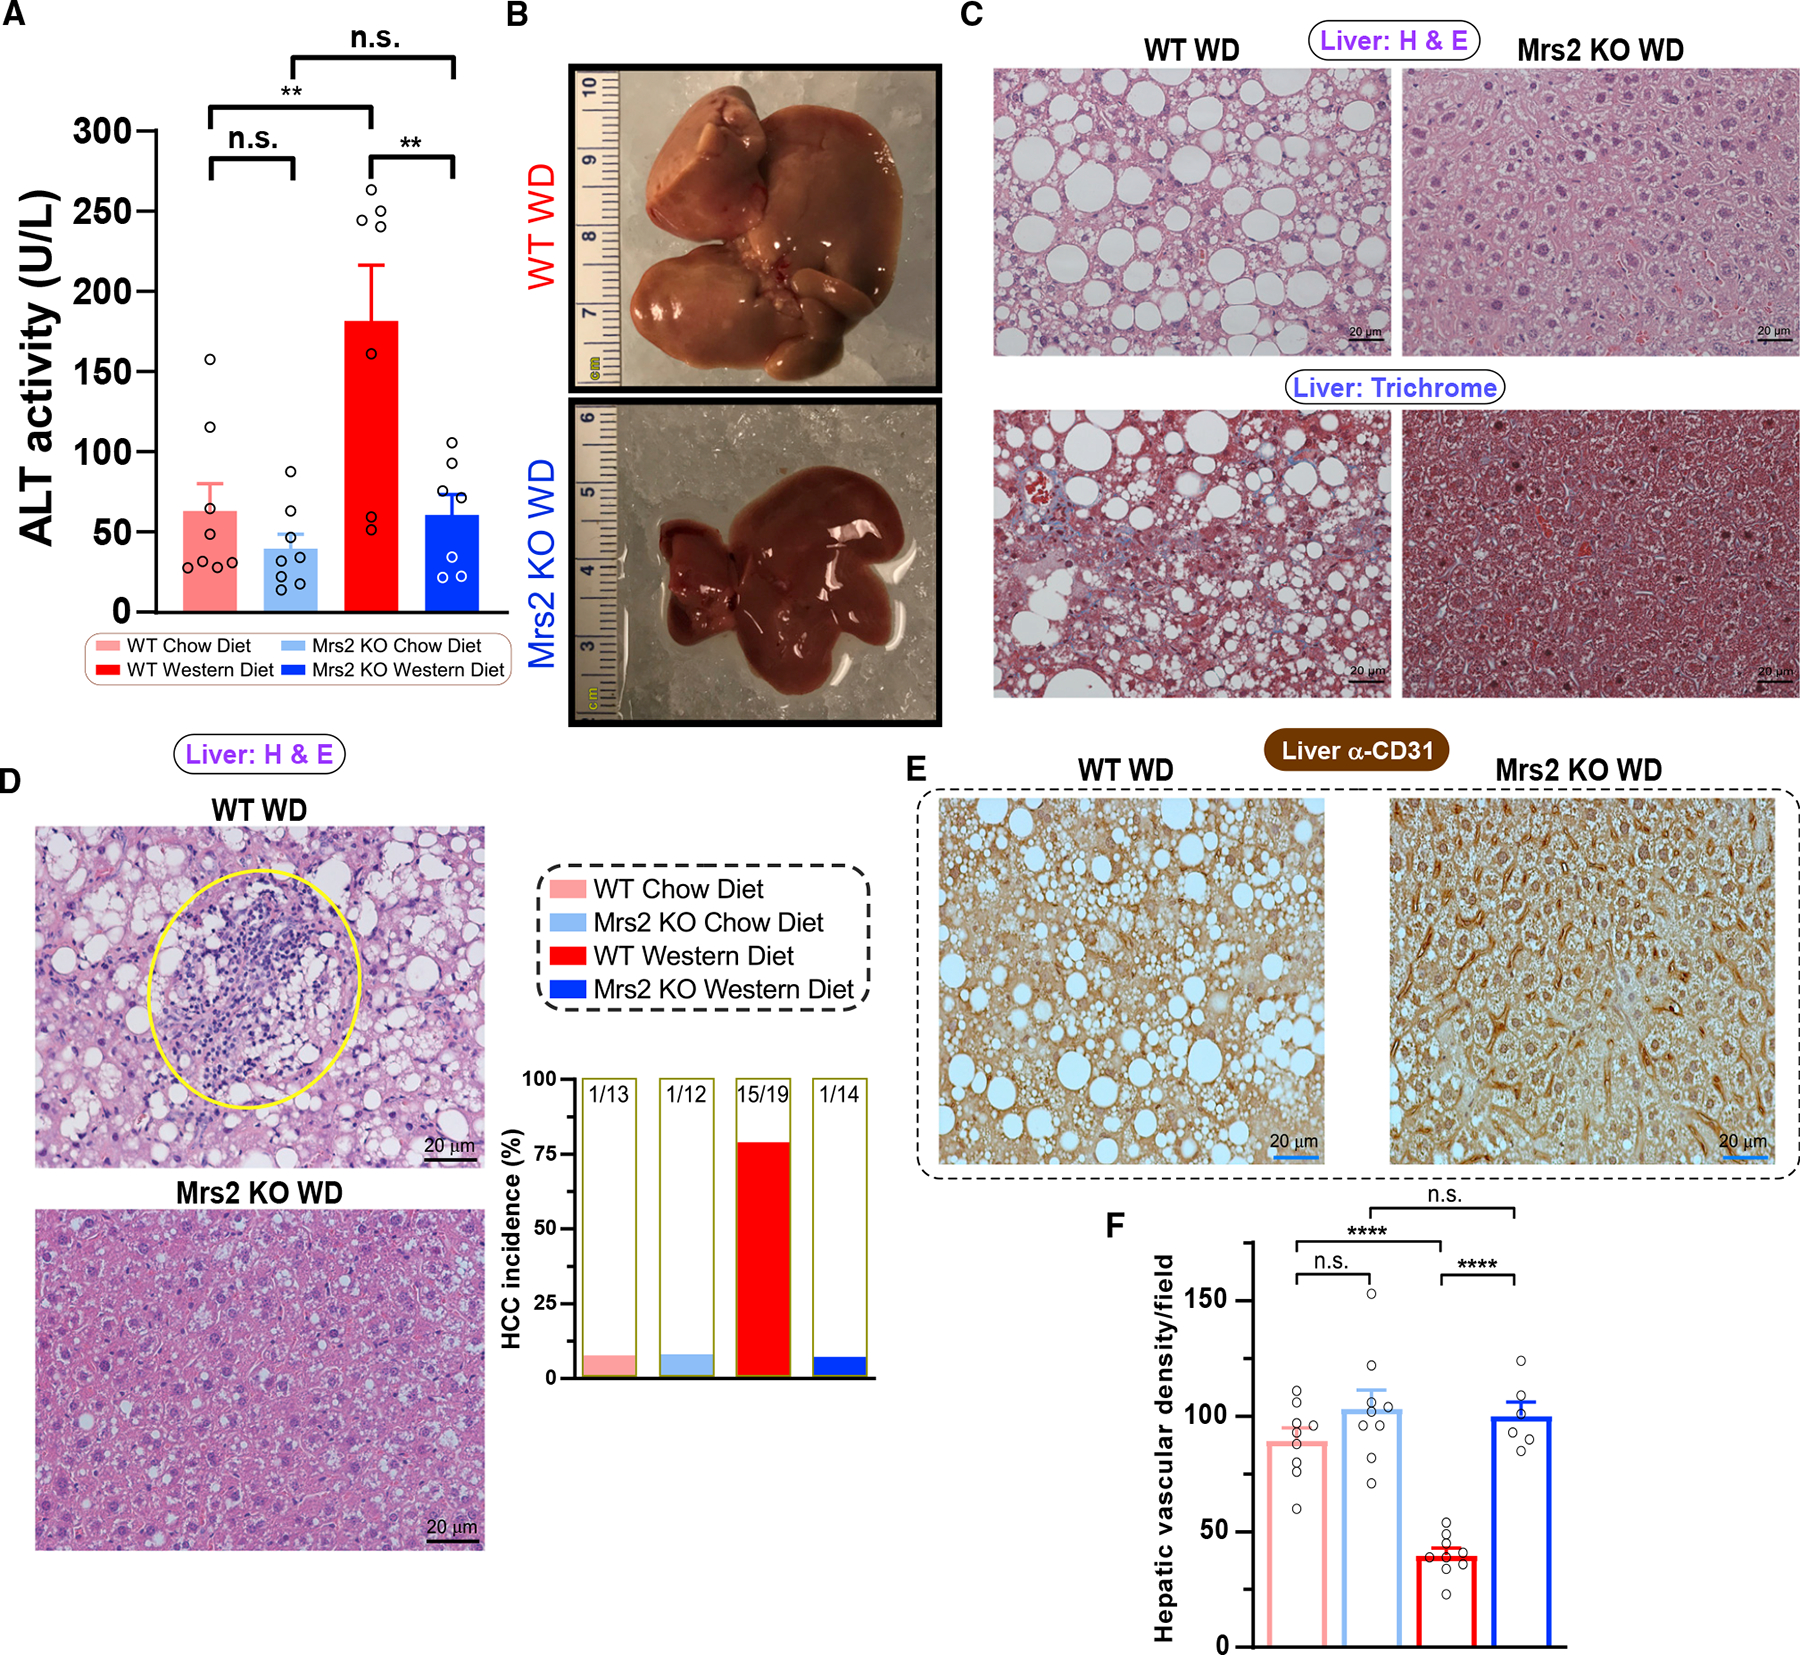
Figure 2. Mrs2 deletion prevents the progression of NAFLD and development of HCC.

(A) ALT levels in the plasma after 1-year diet period. n = 7–8 mice.
(B) Representative liver from WD-fed (1 year) mice, WT (top) and Mrs2−/− (bottom). Scale indicates centimeter.
(C) Representative liver tissue sections stained with H&E (top) and Masson’s trichrome (bottom) from WT and Mrs2−/− fed WD. n = 3 mice.
(D) Representative images of H&E-stained liver sections from 1-year WD-fed mice (WT, top and Mrs2−/−, bottom). Note a focus of immune cell infiltrates (circled) an indicator of tumor nodules. Bar graph represents the hepatocellular carcinoma (HCC) incidence in these four groups. n = 12–19 mice/group.
(E) Immunohistochemical (IHC) analysis (α-CD31/PECAM1) of sinusoidal vasculature in liver from WD-fed WT (left) and Mrs2−/− mice (right). n = 3 mice.
(F) Quantification of hepatic microvascular density from Figure 2E n = 3 mice. Nine images per group were used for quantification. All data shown as mean ± SEM; ****p < 0.0001, **p < 0.01, n.s. = not significant.
