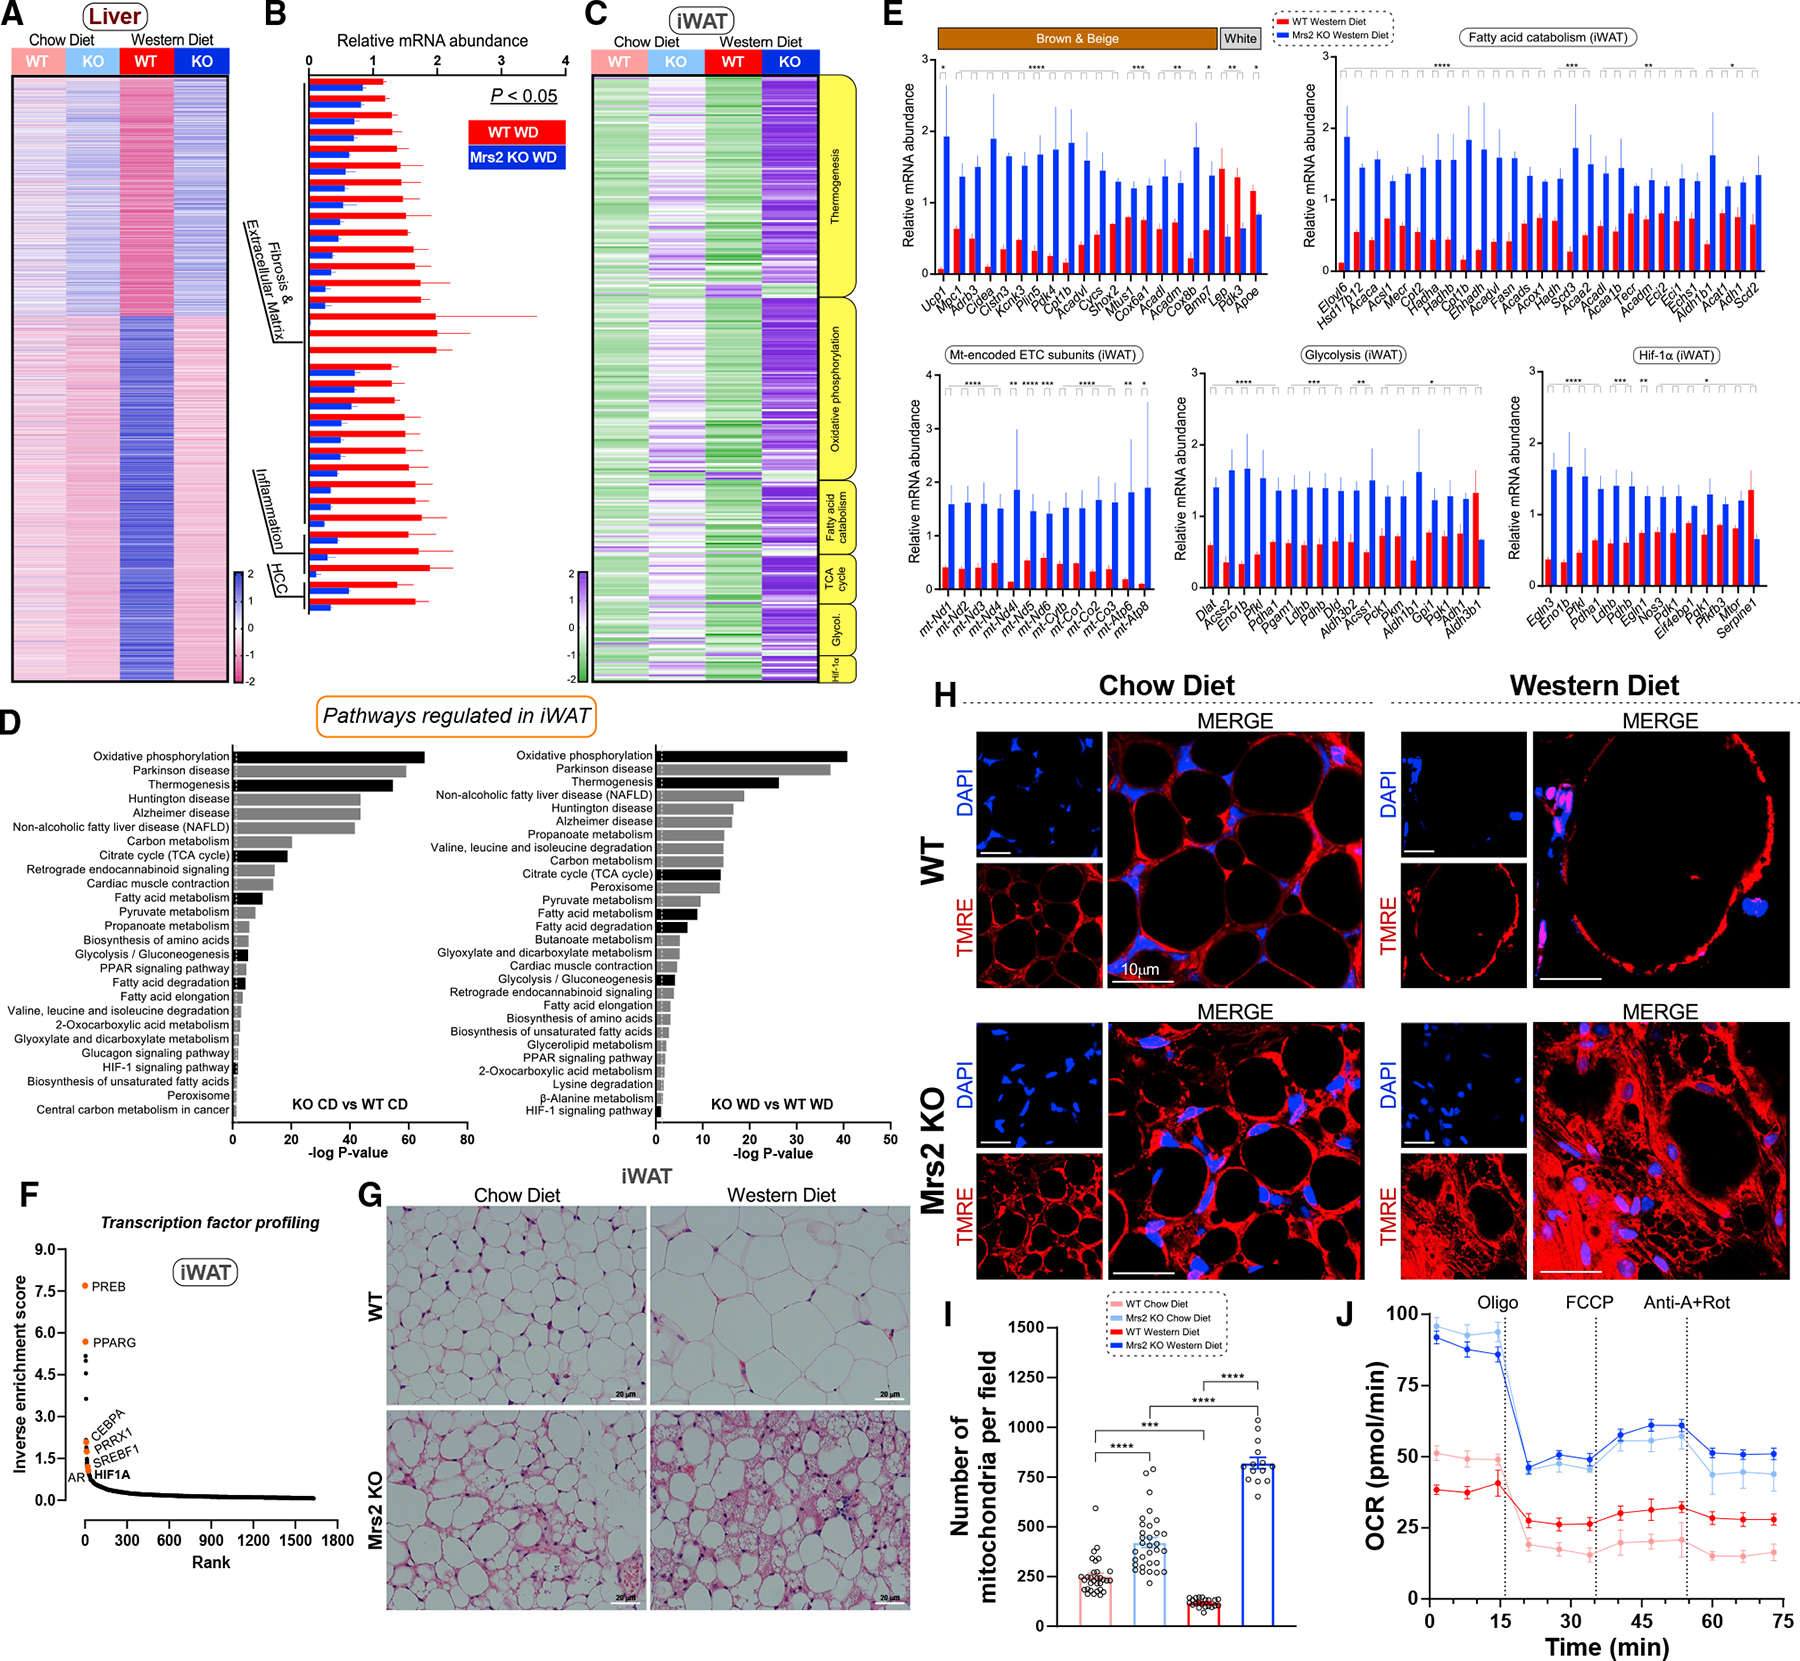
Figure 3. Blunting mMg2+ dynamics enhances hepatic oxidative metabolism profiles and adipocyte browning under Western diet regimen.

(A) Heatmap depicts differentially expressed genes (adj. p < 0.05) in liver tissue from CD- or WD-fed Mrs2−/− vs. WT mice. Values shown as row Z scores. n = 3 mice.
(B) Expression of key marker genes associated with fibrosis/extracellular matrix, inflammation, and HCC (liver; WD-fed mice). Significance was determined by an adjusted p-value of p < 0.05. The FPKM was normalized and expressed as relative mRNA abundance.
(C) Targeted KEGG analysis of iWAT from WT and Mrs2−/− mice fed CD or WD (see STAR Methods). Values shown as row Z scores. n = 3 mice/group.
(D) KEGG gene set enrichment analysis of iWAT with all significantly (adjusted p < 0.05) differentially regulated pathways shown in chow diet comparison (left) and Western diet comparison (right). Pathways of interest are indicated (black). The dotted line indicates significant threshold.
(E) Targeted differential enrichment analysis of adipose tissue from WD-fed WT and Mrs2−/−mice. Graphs indicate key adipose genes, mitochondrial encoded electron transport chain (ETC) subunits, and differentially regulated genes from KEGG pathways indicated as fatty acid catabolism, glycolysis, and HIF1-α signaling. All data are normalized like (B), n = 4 mice. p-values extracted from differential gene expression analysis. Data are mean ± SEM; ****p < 0.0001, ***p < 0.001, **p < 0.01, *p < 0.05.
(F) Transcription factor analysis of WD iWAT using rank-based ChEA software. Select transcription factors highlighted. Y axis depicts mathematical inverse of the enrichment score 3 100.
(G) Representative H&E staining of adipose tissue from WT and Mrs2−/− either fed with CD or WD. n = 4 mice/group.
(H and I) Adipose tissue explants were stained with indicator (TMRE) and DAPI. Live images were acquired and mitochondrial density was quantified (I). n = 3 mice. Fourteen to 32 images per group were used for analysis.
(J) iWAT homogenate from WT and Mrs2−/− mice were subjected to OCR measurement. n = 3 mice.
