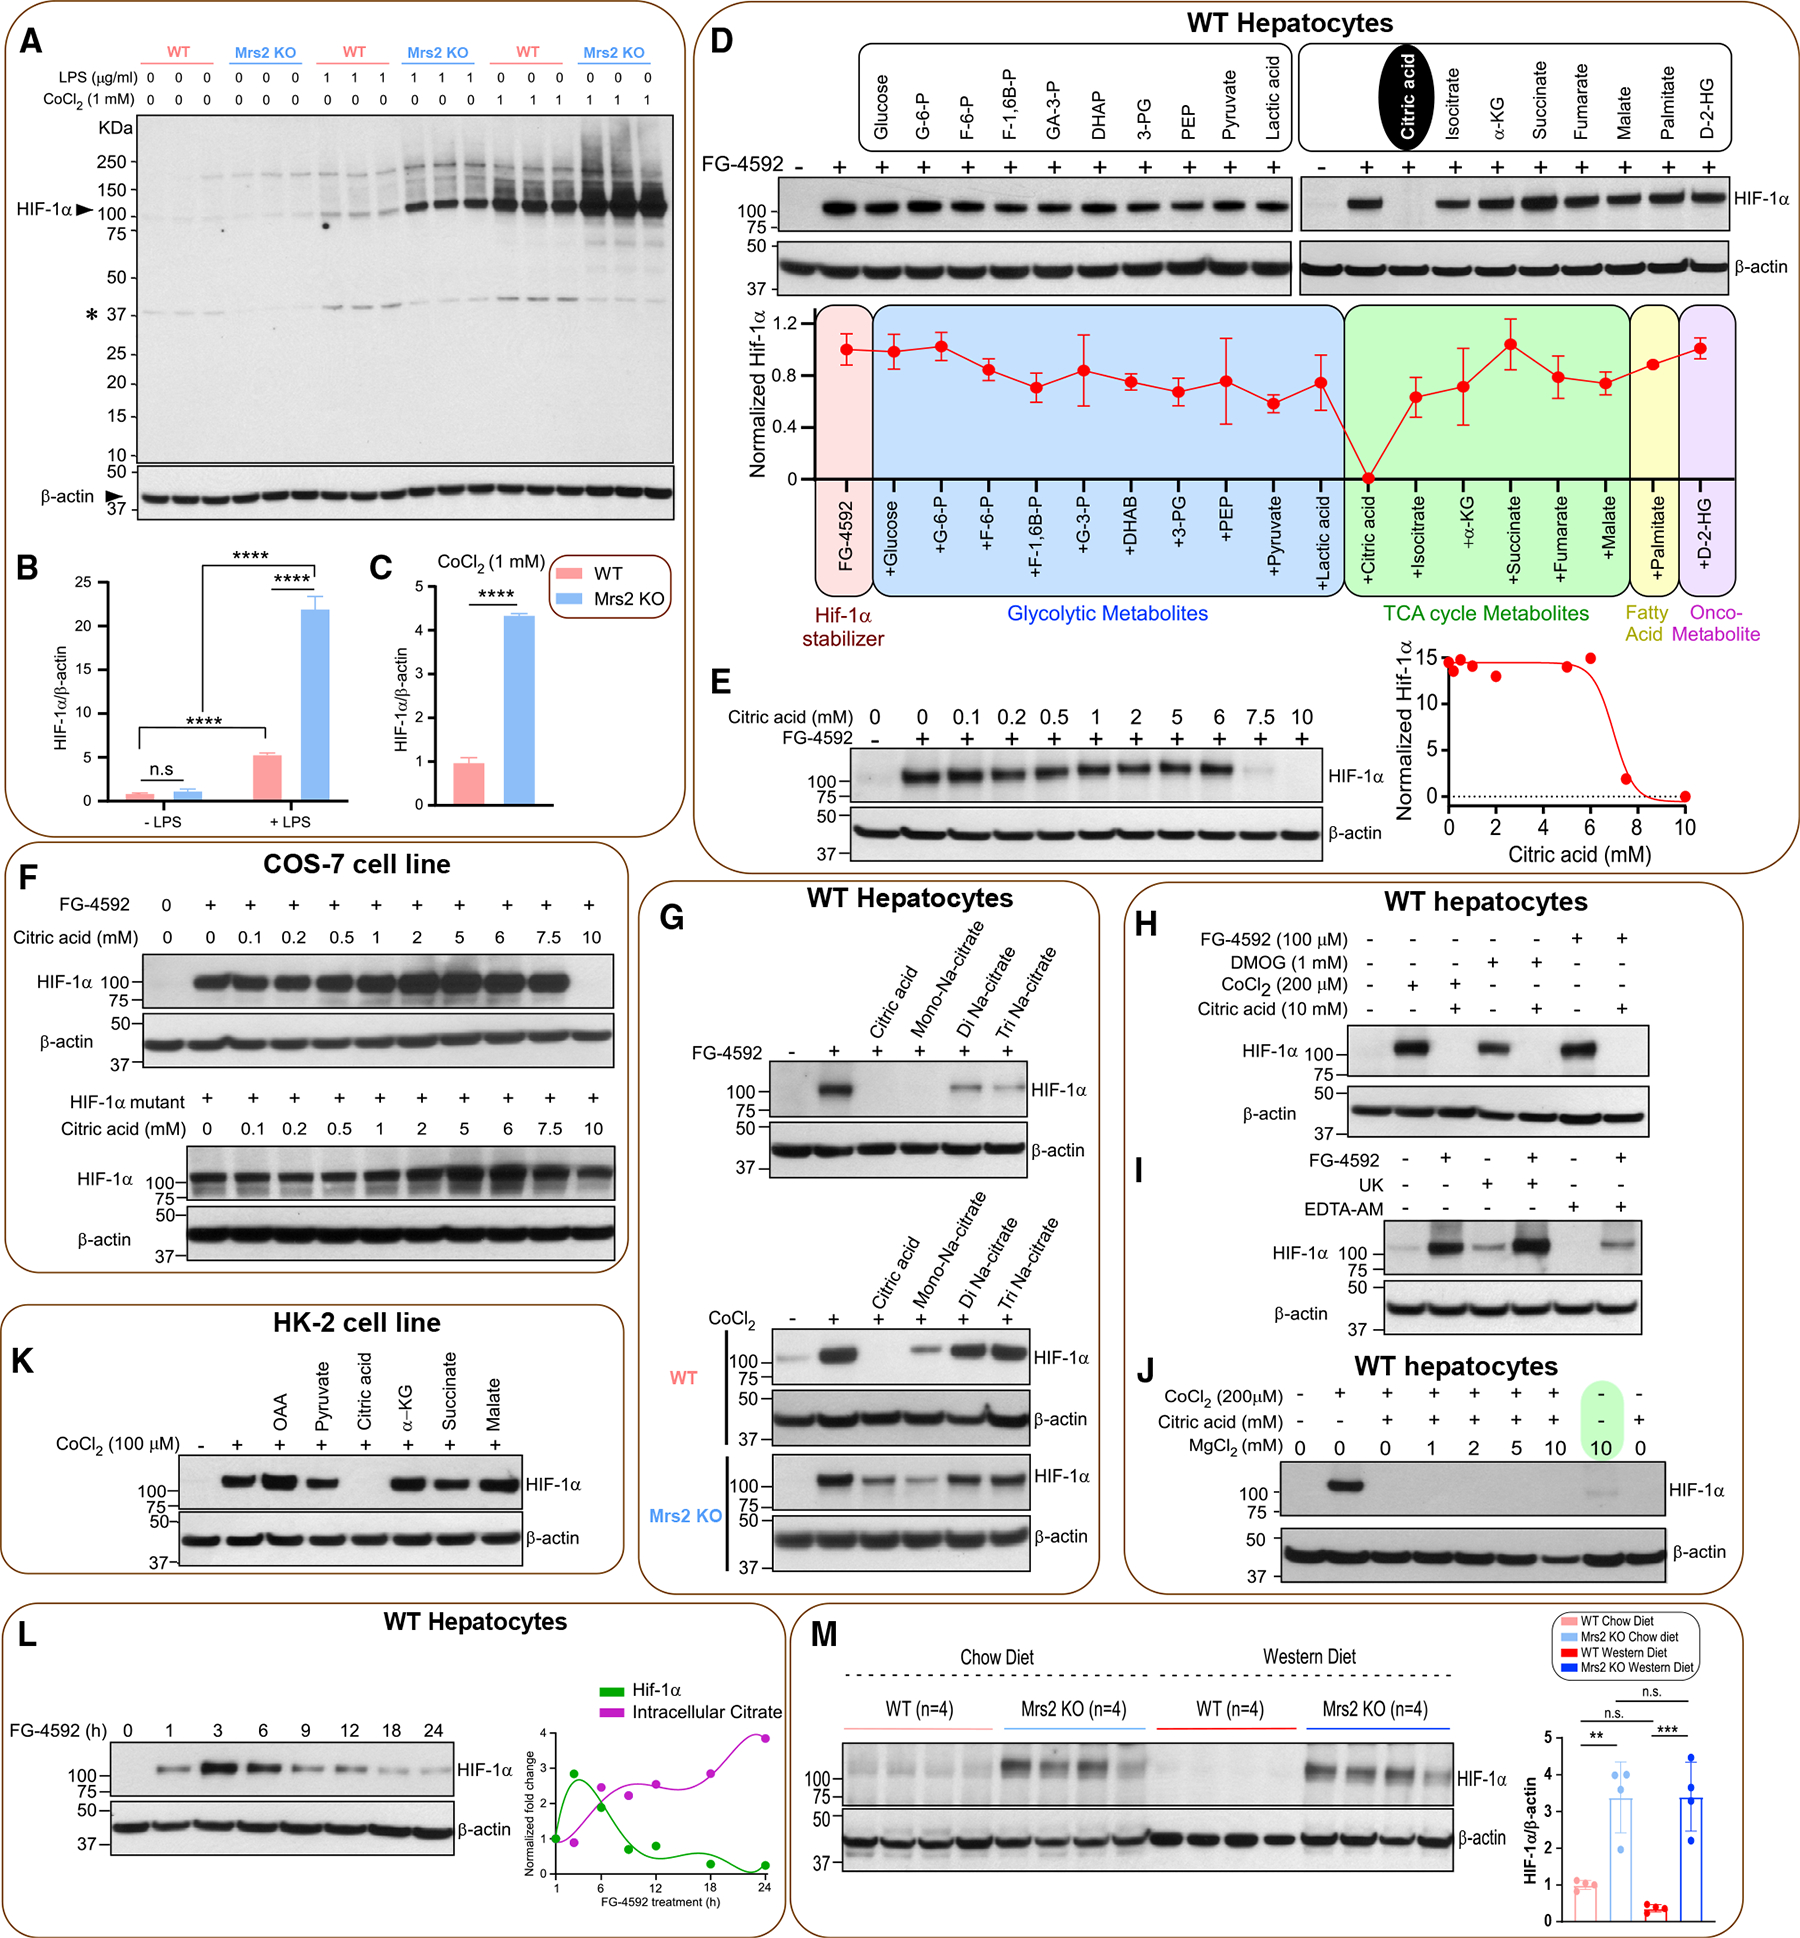
Figure 5. Loss of Mrs2 stabilizes and citric acid destabilizes HIF-1α.

(A) Hepatocytes were treated with LPS or CoCl2 for 6 h. Total lysates were subjected to Western blot analysis to determine HIF-1α protein abundance. n = 3 isolations.
(B and C) ImageJ analysis of HIF-1α protein abundance.
(D) WT hepatocytes were treated with PHD inhibitor FG-4592 (100 mM) for 6 h with or without metabolites. Total cell lysates were probed for HIF-1α protein abundance (see STAR Methods) and quantified (bottom panel) (n = 2).
(E) Dose curve for citrate-induced HIF-1α destabilization. Right panel shows the normalized protein abundance (n = 2).
(F) Top panel shows citrated induced HIF-1α degradation in the presence of various doses of citrate in COS-7 cells (n = 2). Bottom panel depicts the effect of citrate on HIF-1α mutant protein stabilization (n = 2).
(G) Top panel shows the effect of citrate derivatives on FG4592-mediated HIF-1α stabilization (n = 2). Bottom panel shows the effect of citrate on CoCl2-mediated HIF-1α stabilization in WT or Mrs2−/− hepatocytes (n = 2).
(H) Effect of citrate on FG-4952, DMOG, or CoCl2-dependent HIF-1α stabilization in WT hepatocytes (n = 2).
(I) Effect of mitochondrial pyruvate transport blocker UK5099 or iMg2+ chelator EDTA-AM on HIF-1α stabilization (n = 2).
(J) Effect of MgCl2 supplementation on HIF-1α stabilization under normoxia (n = 2).
(K) Effect of TCA cycle citrate precursor OAA or a-KG on HIF-1α destabilization (n = 2).
(L) Intracellular accumulation of citrate elicits HIF-1α destabilization. Right panel depicts reciprocal action of citrate on FG-4592-dependent HIF-1α stabilization (n = 3).
(M) Western blot analysis of HIF-1α protein stabilization in liver tissues harvested from the 1-year diet period of WT and Mrs2−/− mice (n = 4/group). Densitometric analysis of HIF-1α protein from (M). All data shown as mean ± SEM; ****p < 0.0001, ***p < 0.001, **p < 0.01, n.s. = not significant.
