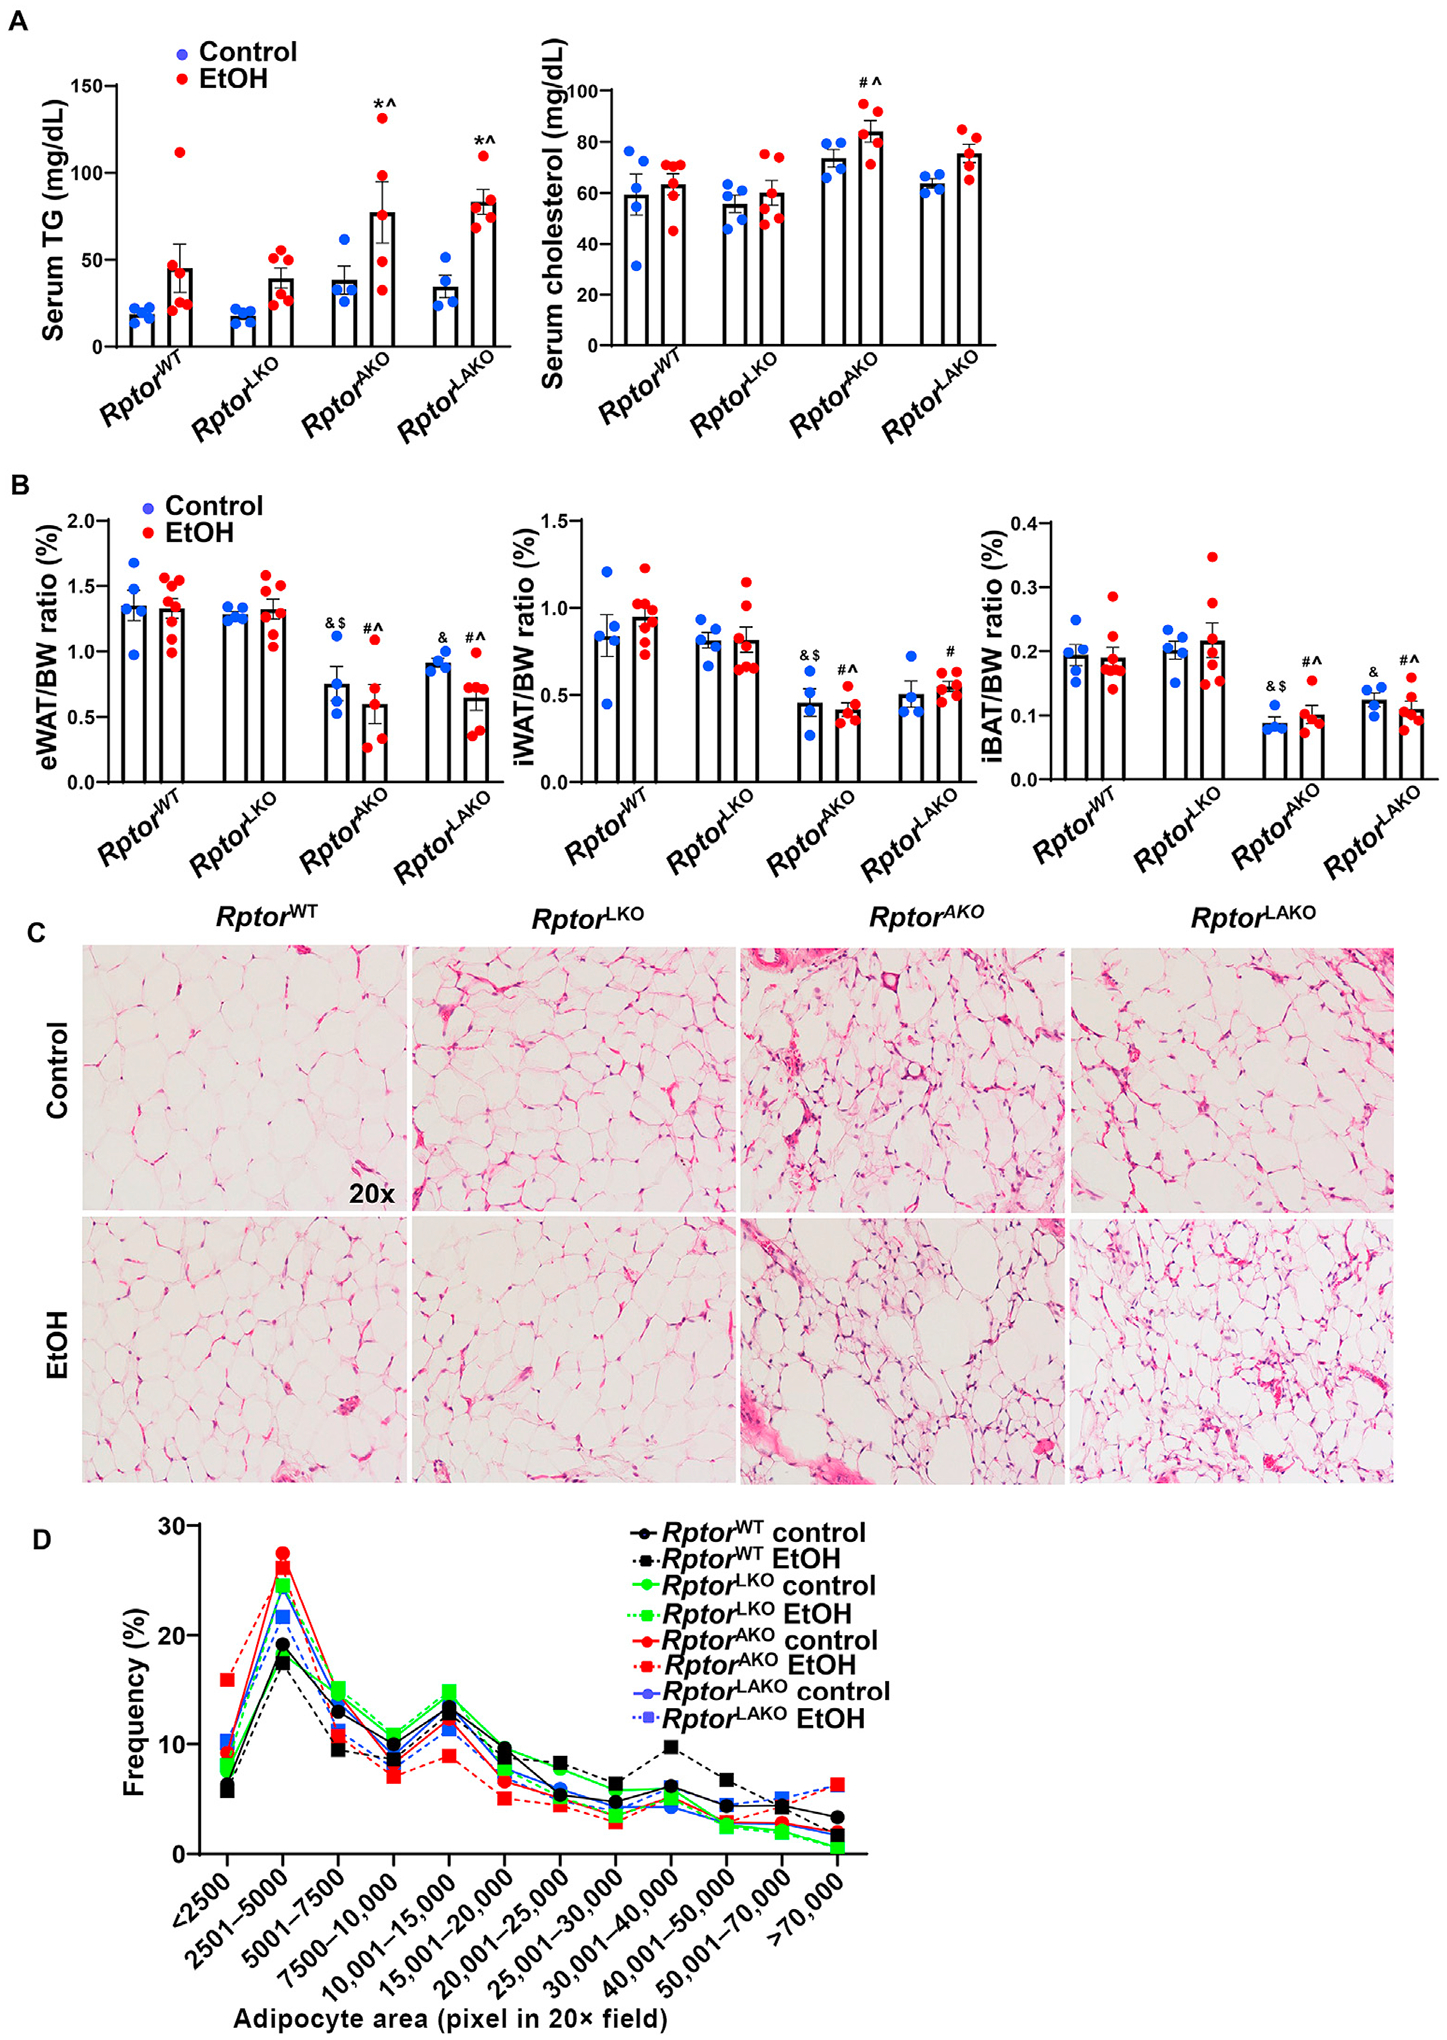
Fig. 5. Adipocyte deletion of Rptor leads to adipose atrophy and is further altered by alcohol in mice.

Mice were treated as in Fig. 4. (A) Serum triglyceride (TG) and cholesterol levels were measured. (B) Adipose tissue/BW ratio was quantified. (C) Representative images of H&E staining of eWAT. (D) Distribution of adipocyte area of eWAT was analyzed. Around 1783–3207 adipocytes from 2 to 4 mice in each group were quantified. Data are expressed as means ± SEM (n = 4 to 7, A, B) and subjected to one-way ANOVA with Turkey post hoc test. *P < 0.05 EtOH vs. control; #P < 0.05 vs. WT EtOH; ^P < 0.05 vs. LKO EtOH; &P < 0.05 vs. WT control; $P < 0.05 vs. LKO control. Original magnification, × 20. Abbreviations: BW, body weight; EtOH, ethanol; eWAT, epididymal white adipose tissue; H&E, hematoxylin and eosin; iBAT, interscapular brown adipose tissue; iWAT, inguinal white adipose tissue; KO, knockout; Rptor, regulatory-associated protein of mTOR; TG, triglyceride; WT, wild-type.
