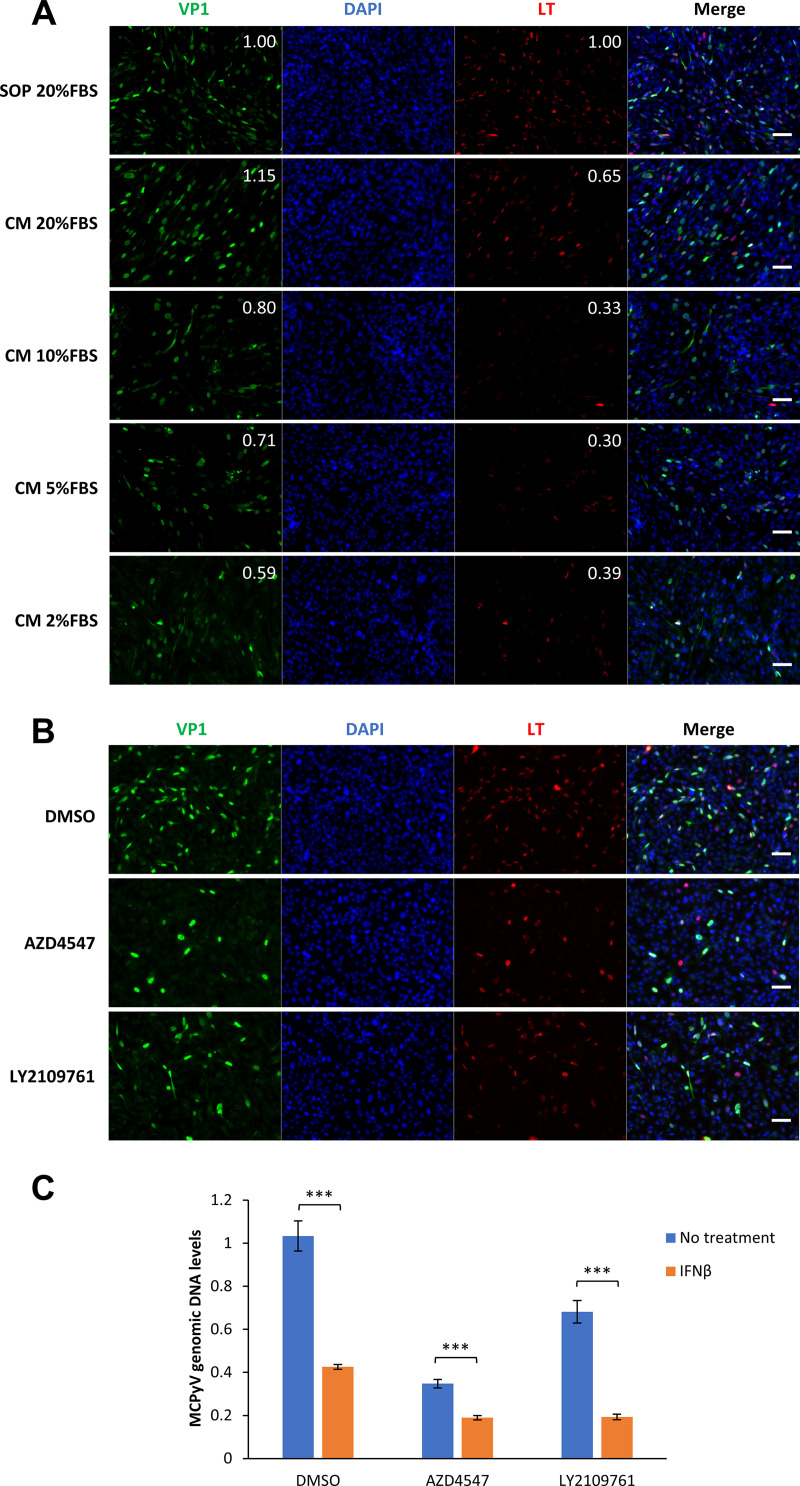
FIG 8.
Growth factors in FBS stimulate MCPyV infection. (A) HDFs were treated with MCPyV. On day 2 postinfection, one group of the cells was maintained in the infection medium and supplemented with 20% FBS according to our standard infection protocol (SOP). For the other two groups of cells, the medium was changed to fresh medium (CM) supplemented with 20%, 10%, 5%, or 2% FBS. Cells were fixed on day 5 postinfection, immunostained for VP1 and LT, and counterstained with DAPI. The brightness of the IF signal was quantified using the IntDen (integrated density) function of ImageJ software. The values for the SOP photos were set as 1. The relative brightness of VP1 and LT signals was calculated by normalizing each value to the DAPI signal (top right corners). Bars, 100 μm. (B) MCPyV-infected or mock-infected HDFs were treated with DMSO, 1 μM AZD4547, or 2 μM LY2109761 on day 2 postinfection. Cells were fixed on day 5 postinfection, immunostained for VP1 and LT, and counterstained with DAPI. Bars, 100 μm. (C) MCPyV-infected HDFs were either untreated or treated with 100 U/mL IFN-β for 3 h on day 2 postinfection. The cells were then treated with 20% FBS and either DMSO, 1 μM AZD4547, or 2 μM LY2109761. Cells were harvested for DNA extraction on day 5 postinfection. MCPyV genomic DNA levels were determined by qPCR quantification and normalized to the GAPDH genomic DNA levels. The value for one of the MCPyV-infected, DMSO-treated samples without IFN treatment was set as 1. Error bars represent the standard deviations from three independent experiments. ***, P < 0.001.

