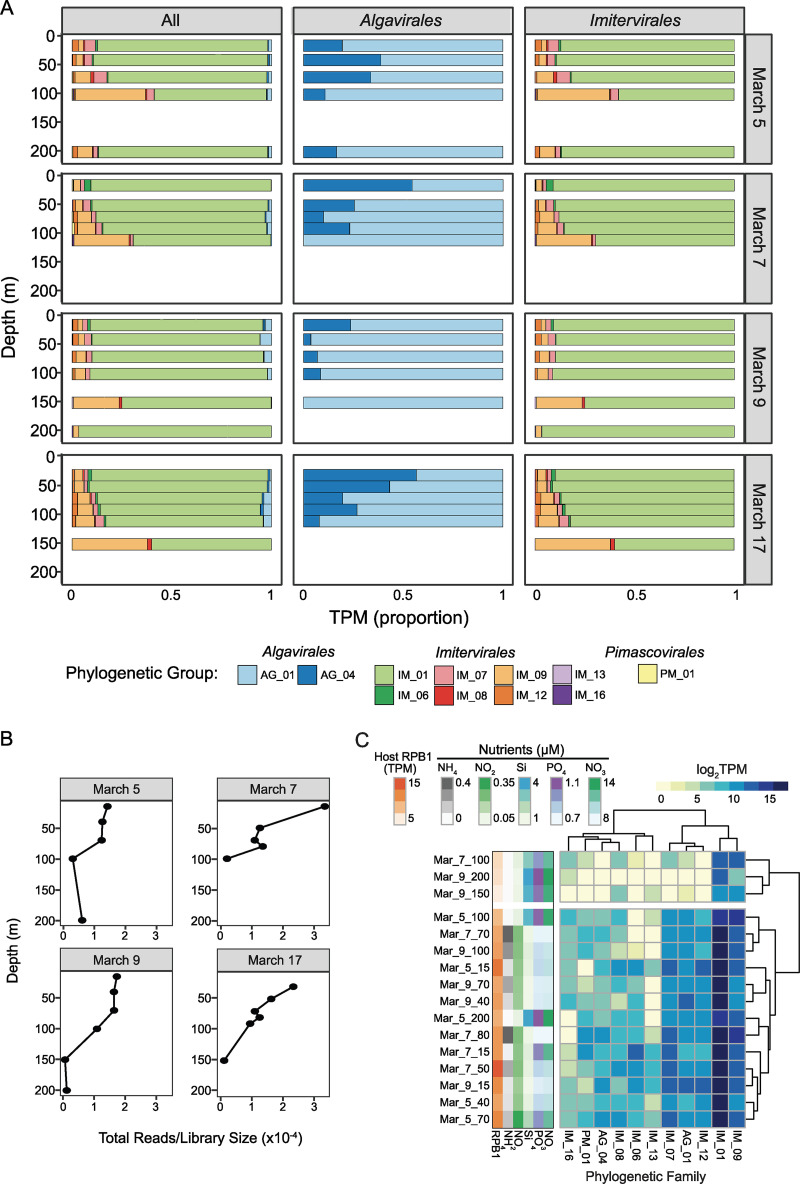
FIG 2.
Taxon-specific transcript abundance patterns of Nucleocytoviricota across a depth-dependent and temporal scale. (A) Shifts in proportions of normalized transcripts assigned to different Nucleocytoviricota genomes by family. (B) Total Nucleocytoviricota transcript counts with depth, normalized by library size. (C) Heatmap of family-level-summed Nucleocytoviricota transcript abundances across depth profiles sampled on March 5, 7, and 9 with corresponding nutrient and total eukaryotic RPB1 transcript abundance data along the left-hand side. Data for March 17 were omitted due to lack of nutrient data. Family-level color codes have been changed (compared to Fig. 1) for visual purposes. Only the short-hand names of the family-level assignments are shown.

