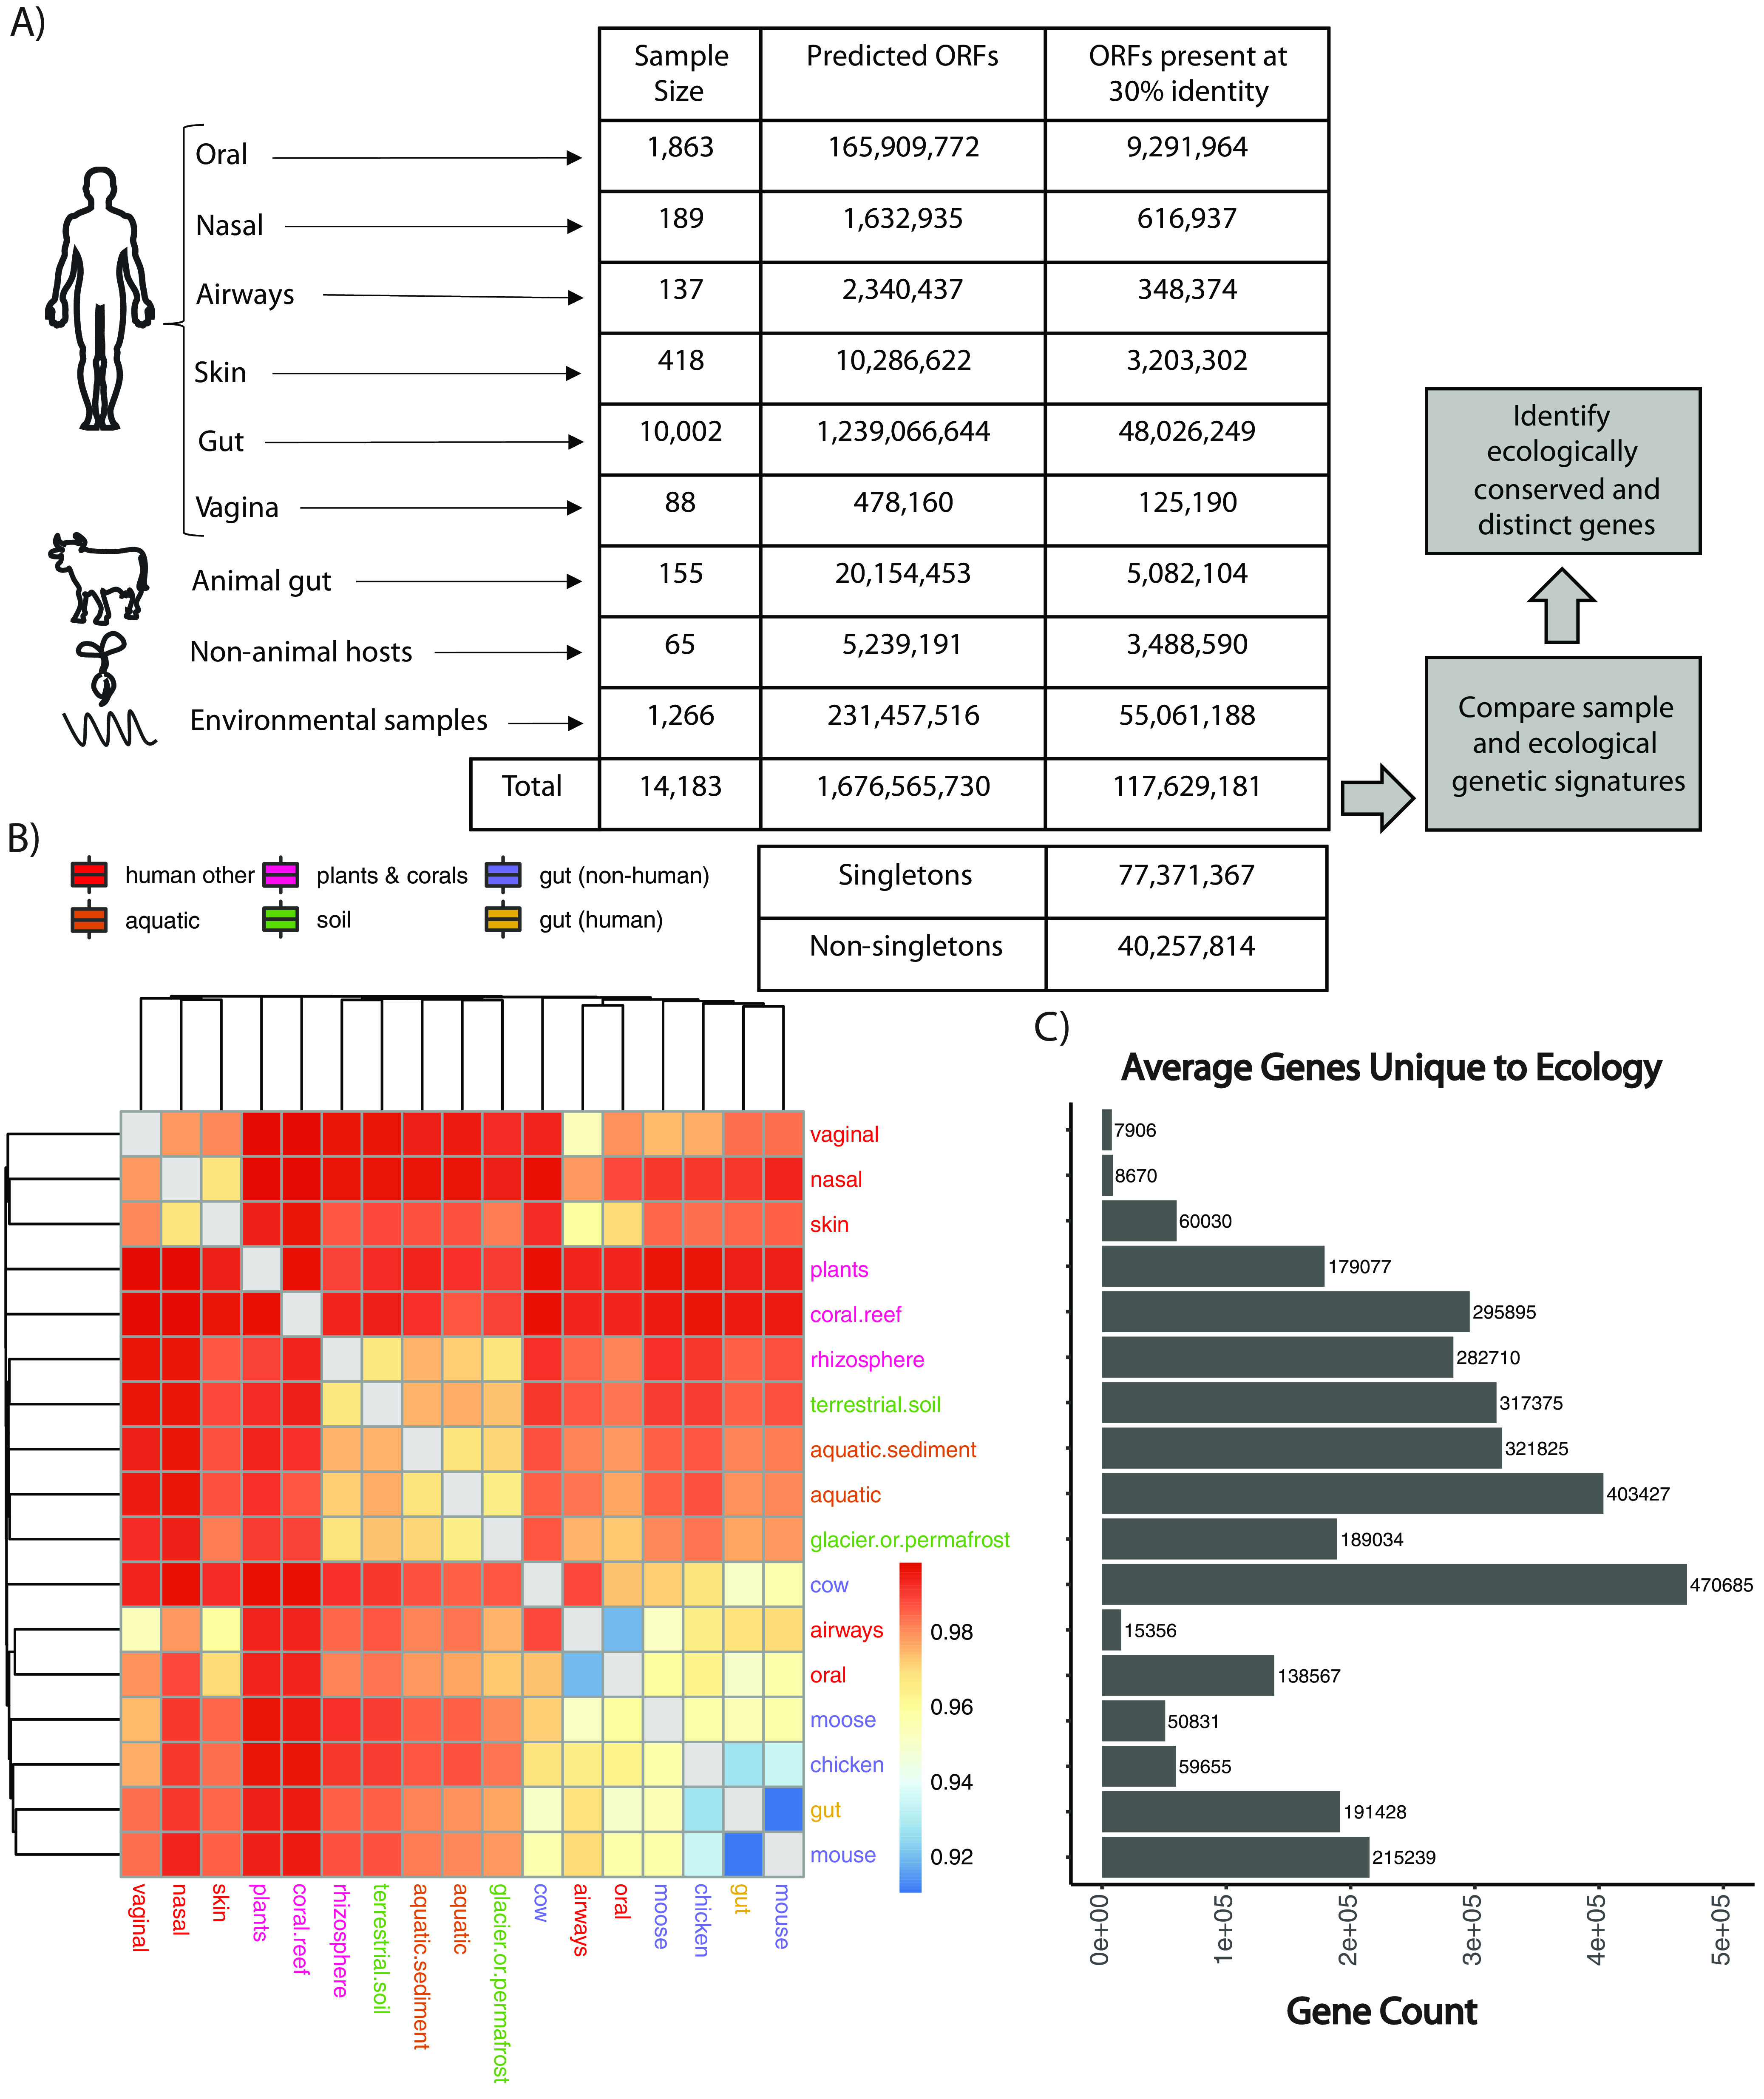
FIG 1.

Overview of approach and results and genetic similarity between ecologies. (A) Statistics regarding the gene and sample content of our database at the 30% clustered sequence identity and the high-level analytical steps we took in the manuscript. (B) Hierarchical clustering on the Jaccard distance between ecologies as a function of iterative sampling. Each cell represents the average Jaccard distance between two ecologies (in rows and columns) after 50 random samplings. Cell color is in units of Jaccard distance. The color of text corresponds to broader ecology class. (C) Average number of genes unique to (found only in) a given ecology.
