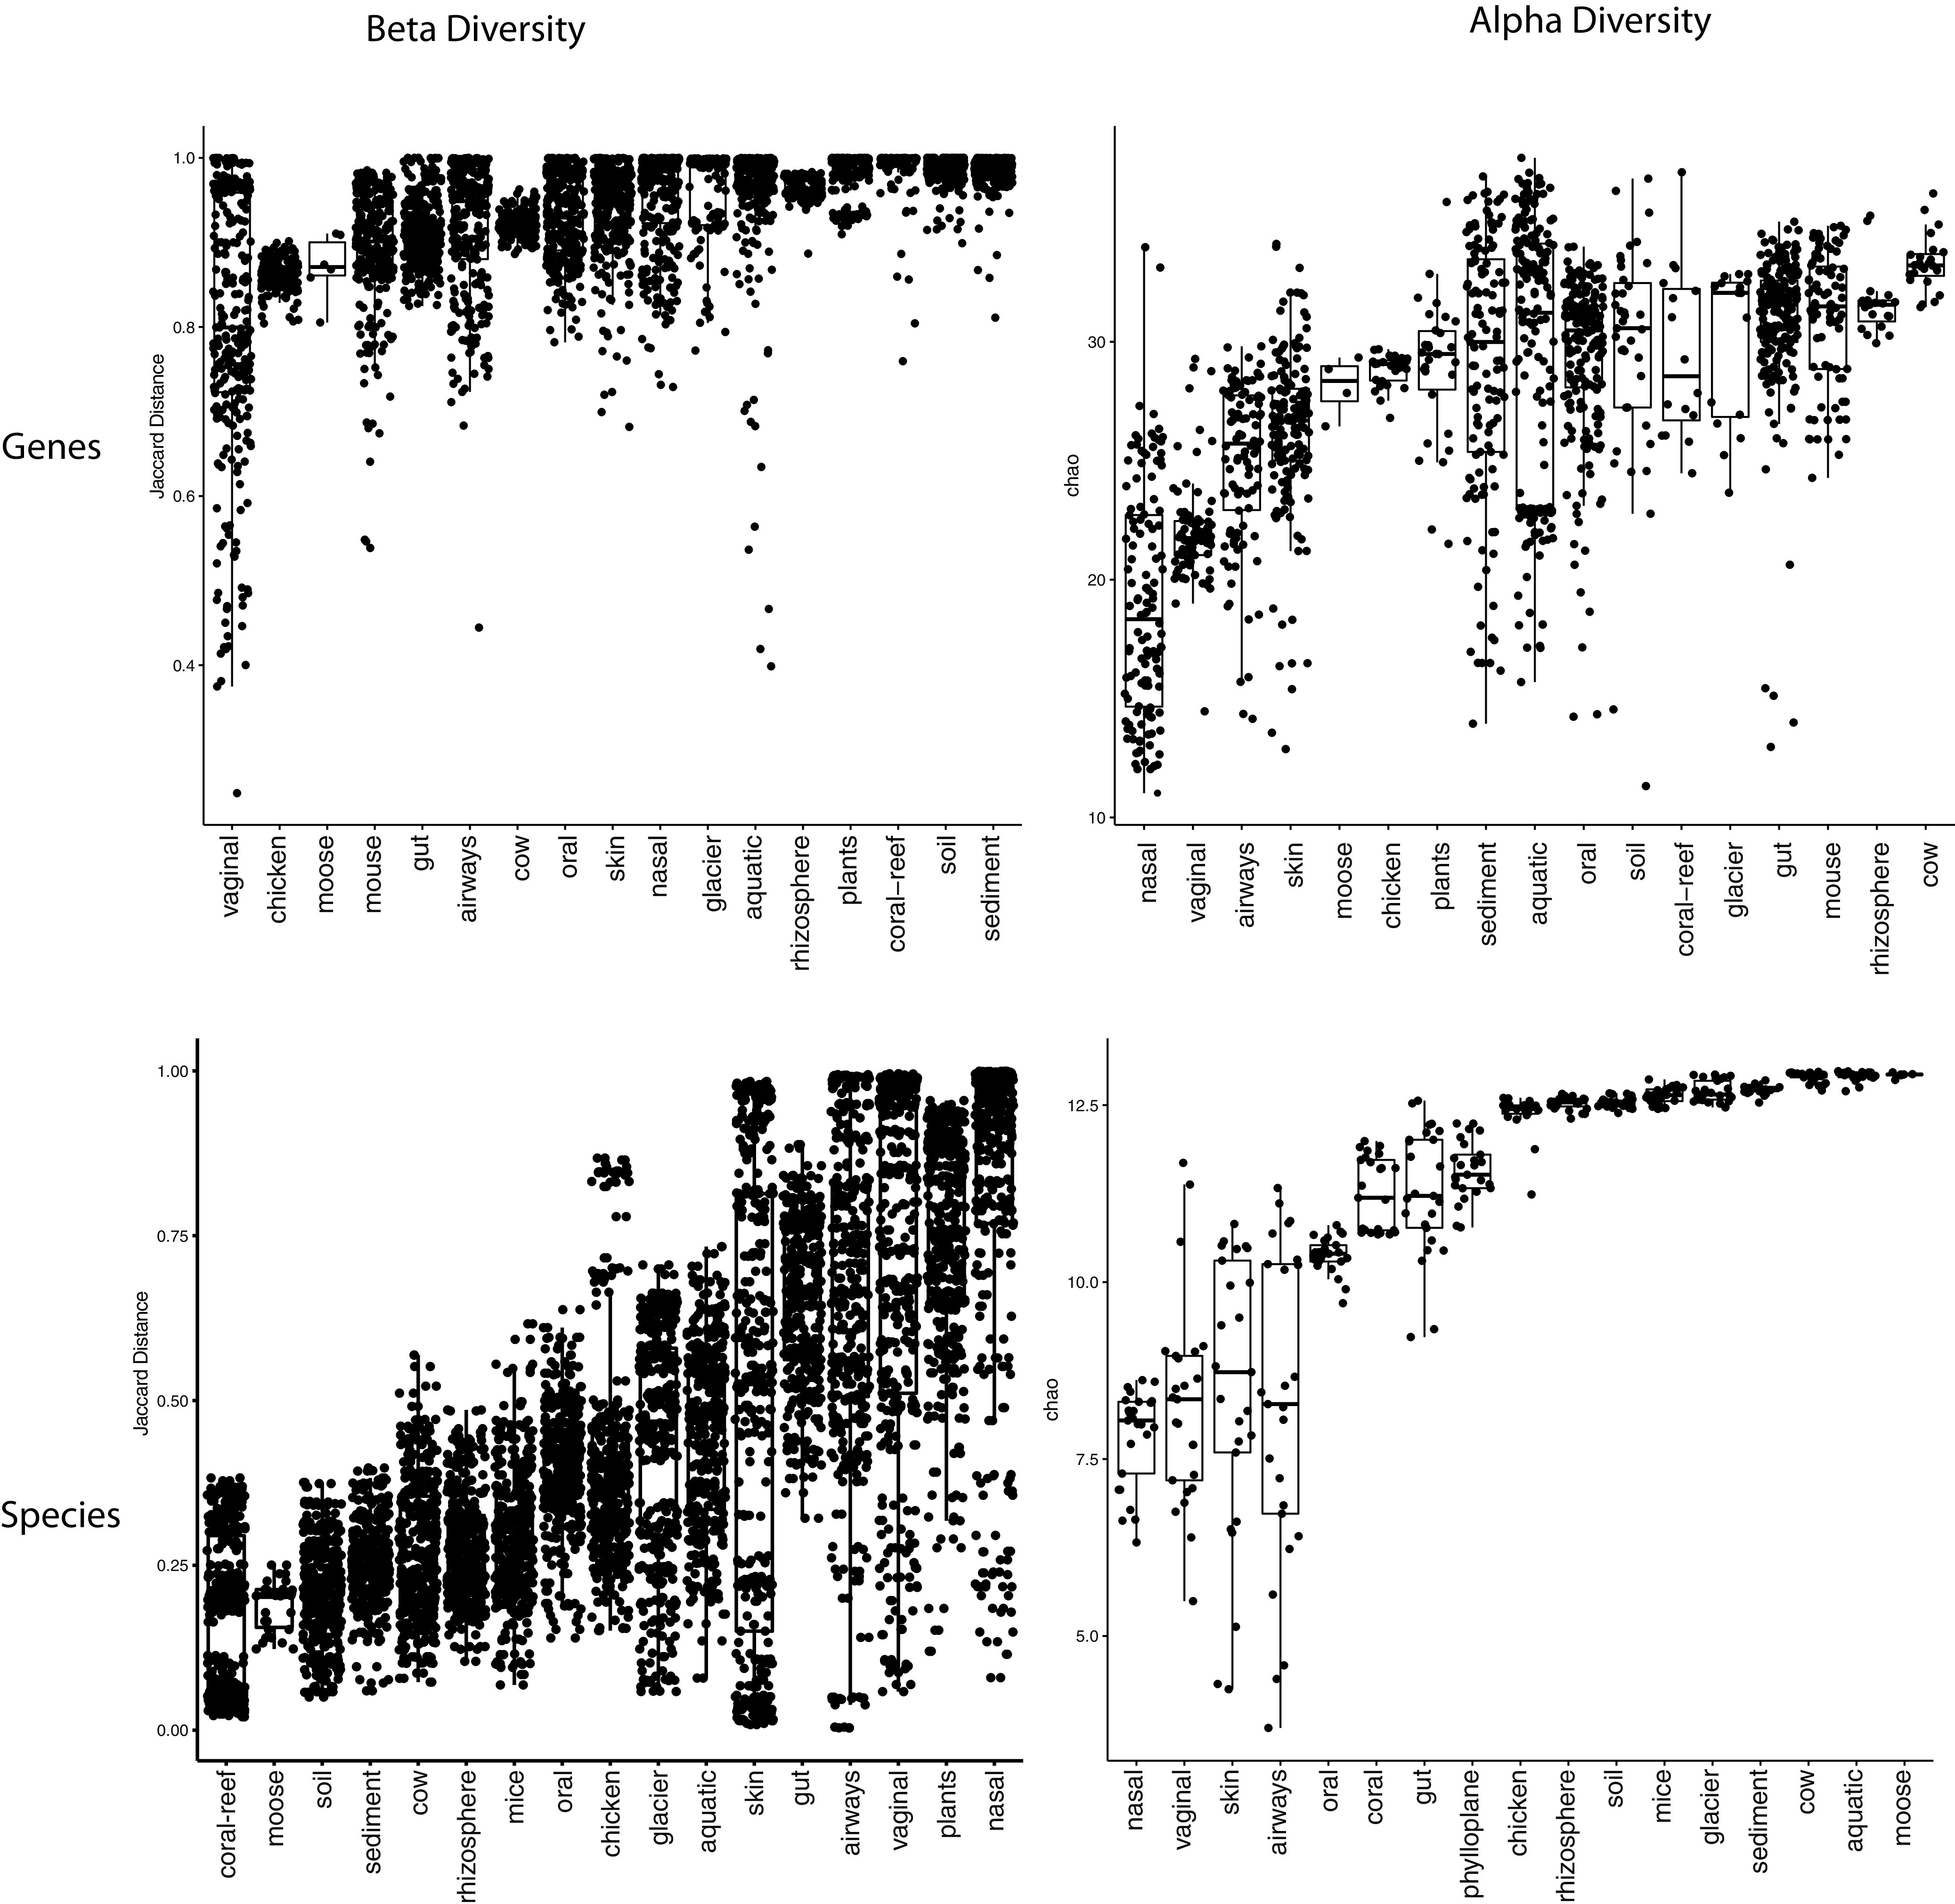
FIG 2.

Alpha and within-ecology beta diversity of samples in each ecology. (Top left) Jaccard distance between each pair of samples used in Fig. 1B computed through shared gene content. (Bottom left) Bray-Curtis distance between each pair of samples in each ecology calculated via species abundance from Table S4 in the supplemental material. (Top right) Chao2 richness estimator of each sample used in Fig. 1B. (Bottom right) The Chao1 richness estimator of 4 samples from each ecology from Table S4 calculated via species abundance.
