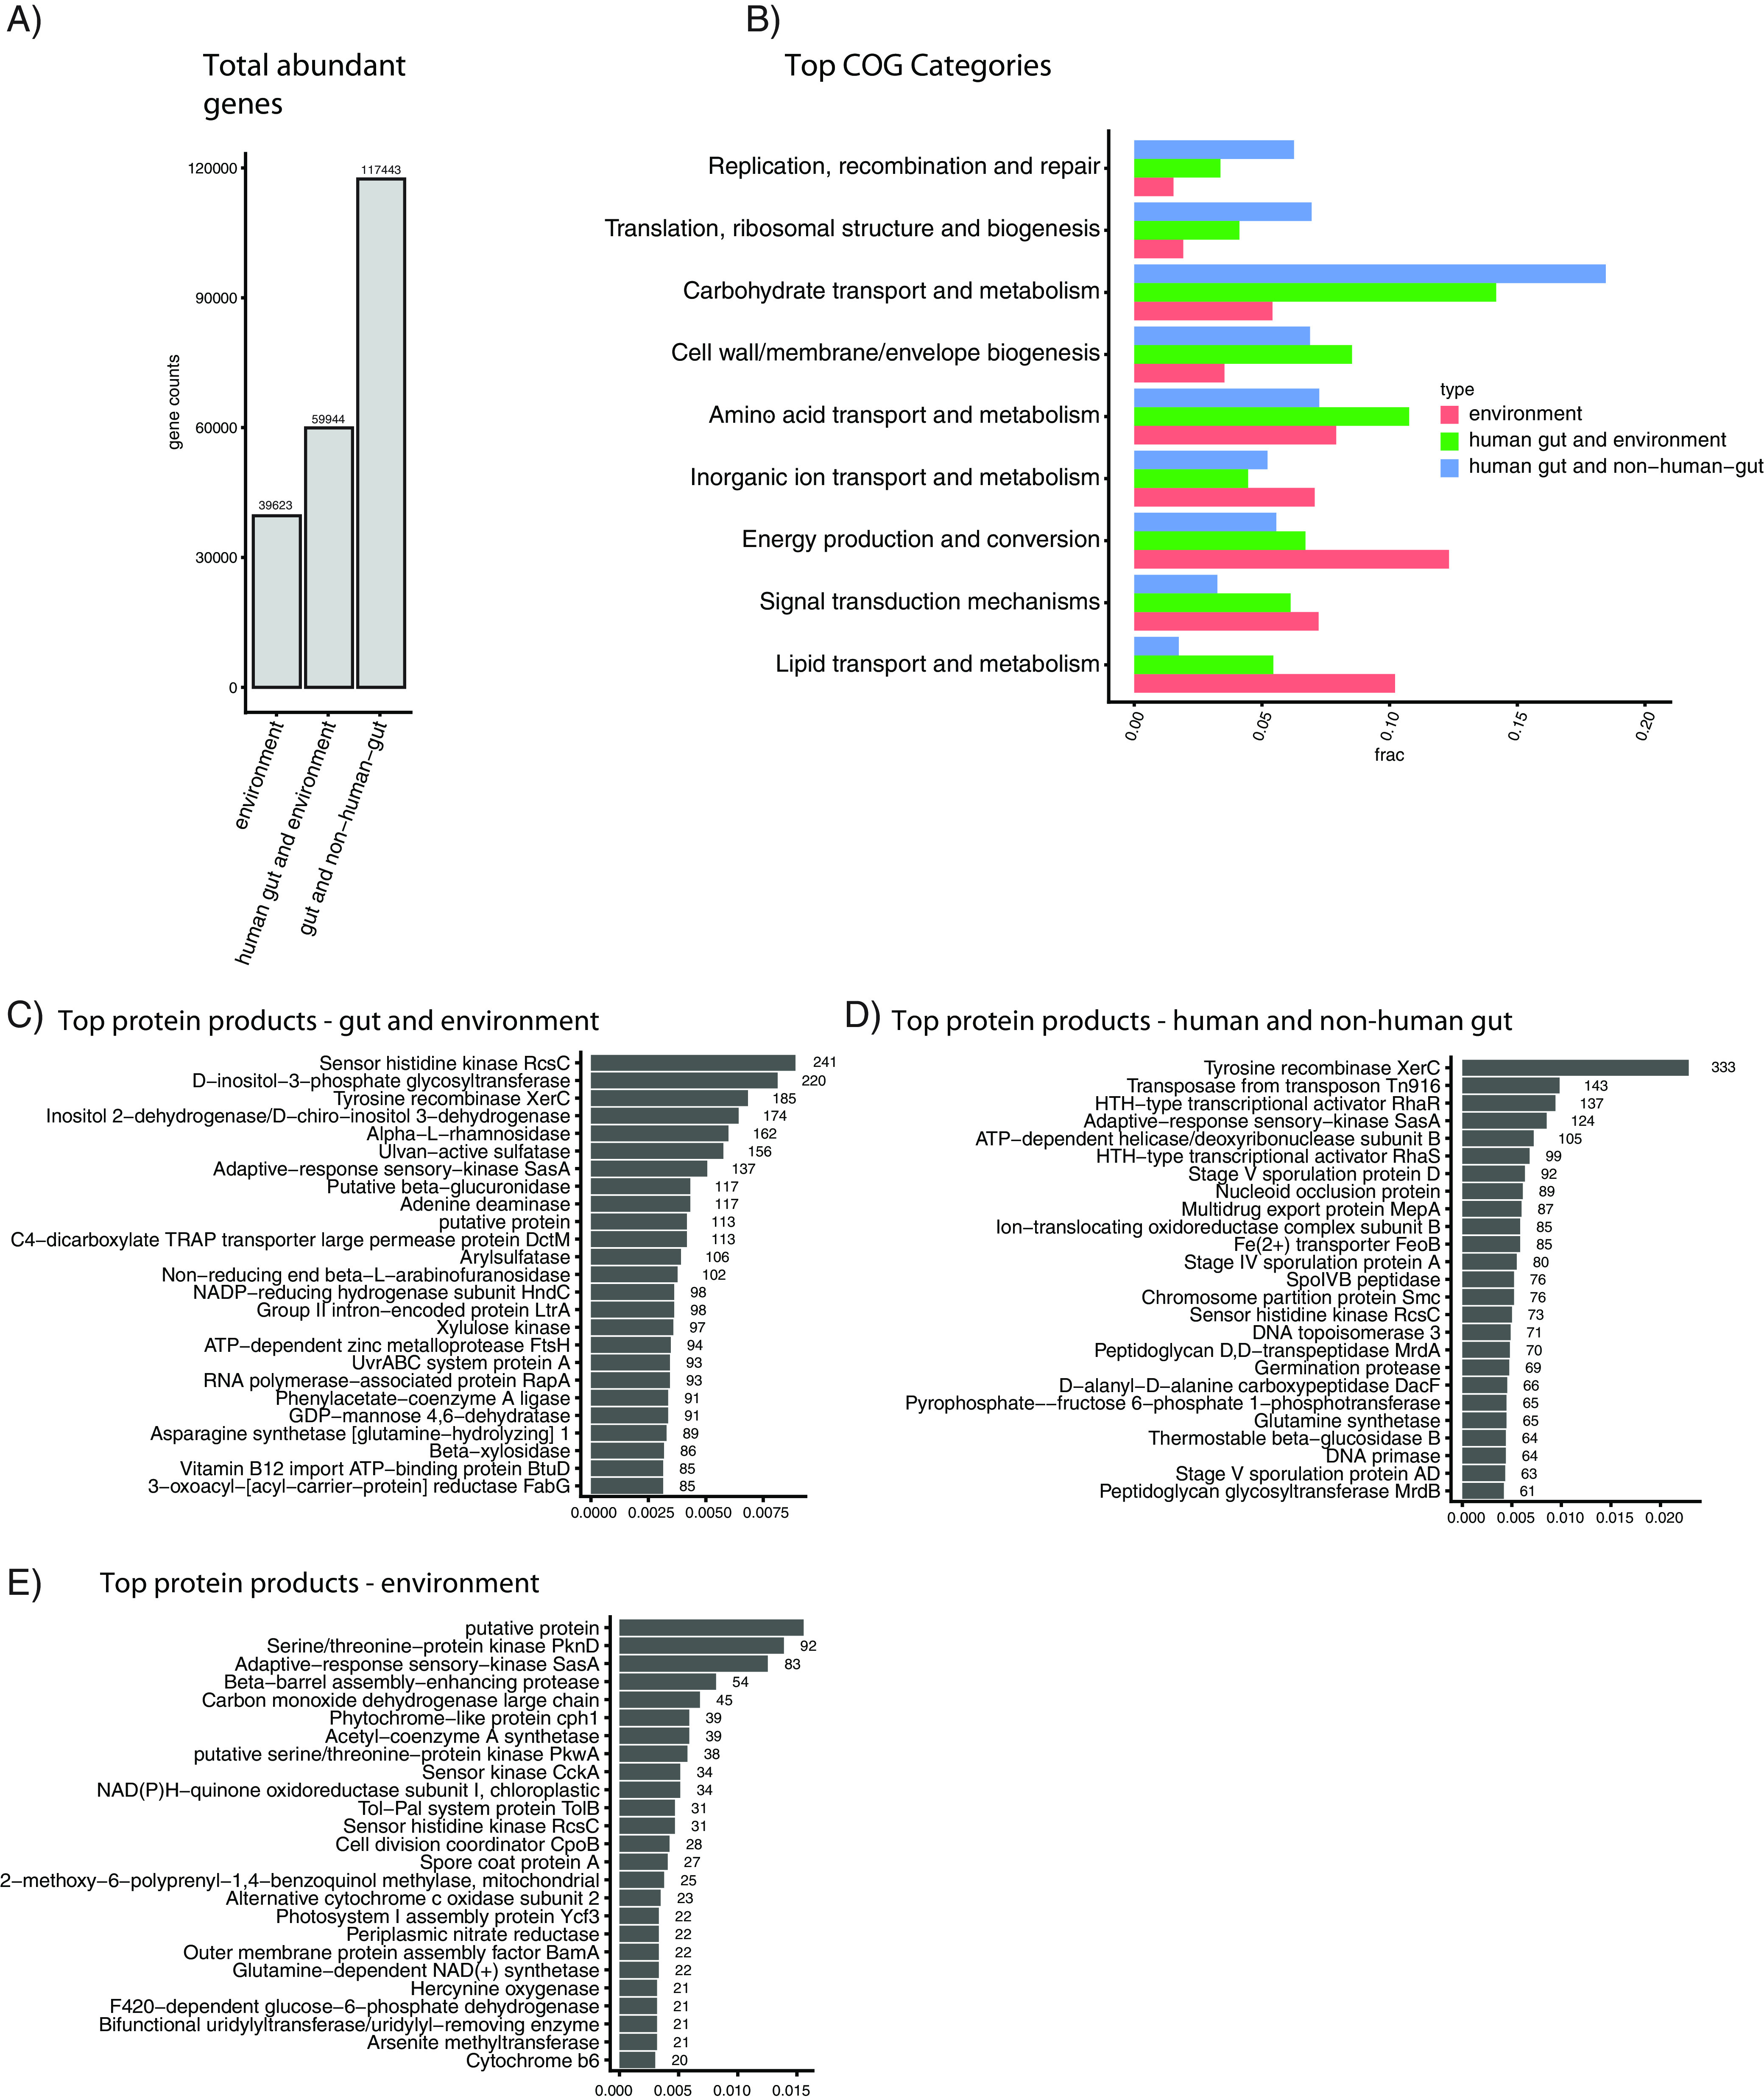
FIG 4.

Functional analysis of genes abundant in different ecological contexts. (A) Total number of genes captured in the differential abundance analysis. (B) Fraction of genes in the different high-level COG categories, by intersection. (C to E) The top 25 most common protein products for each ecological comparison considered.
