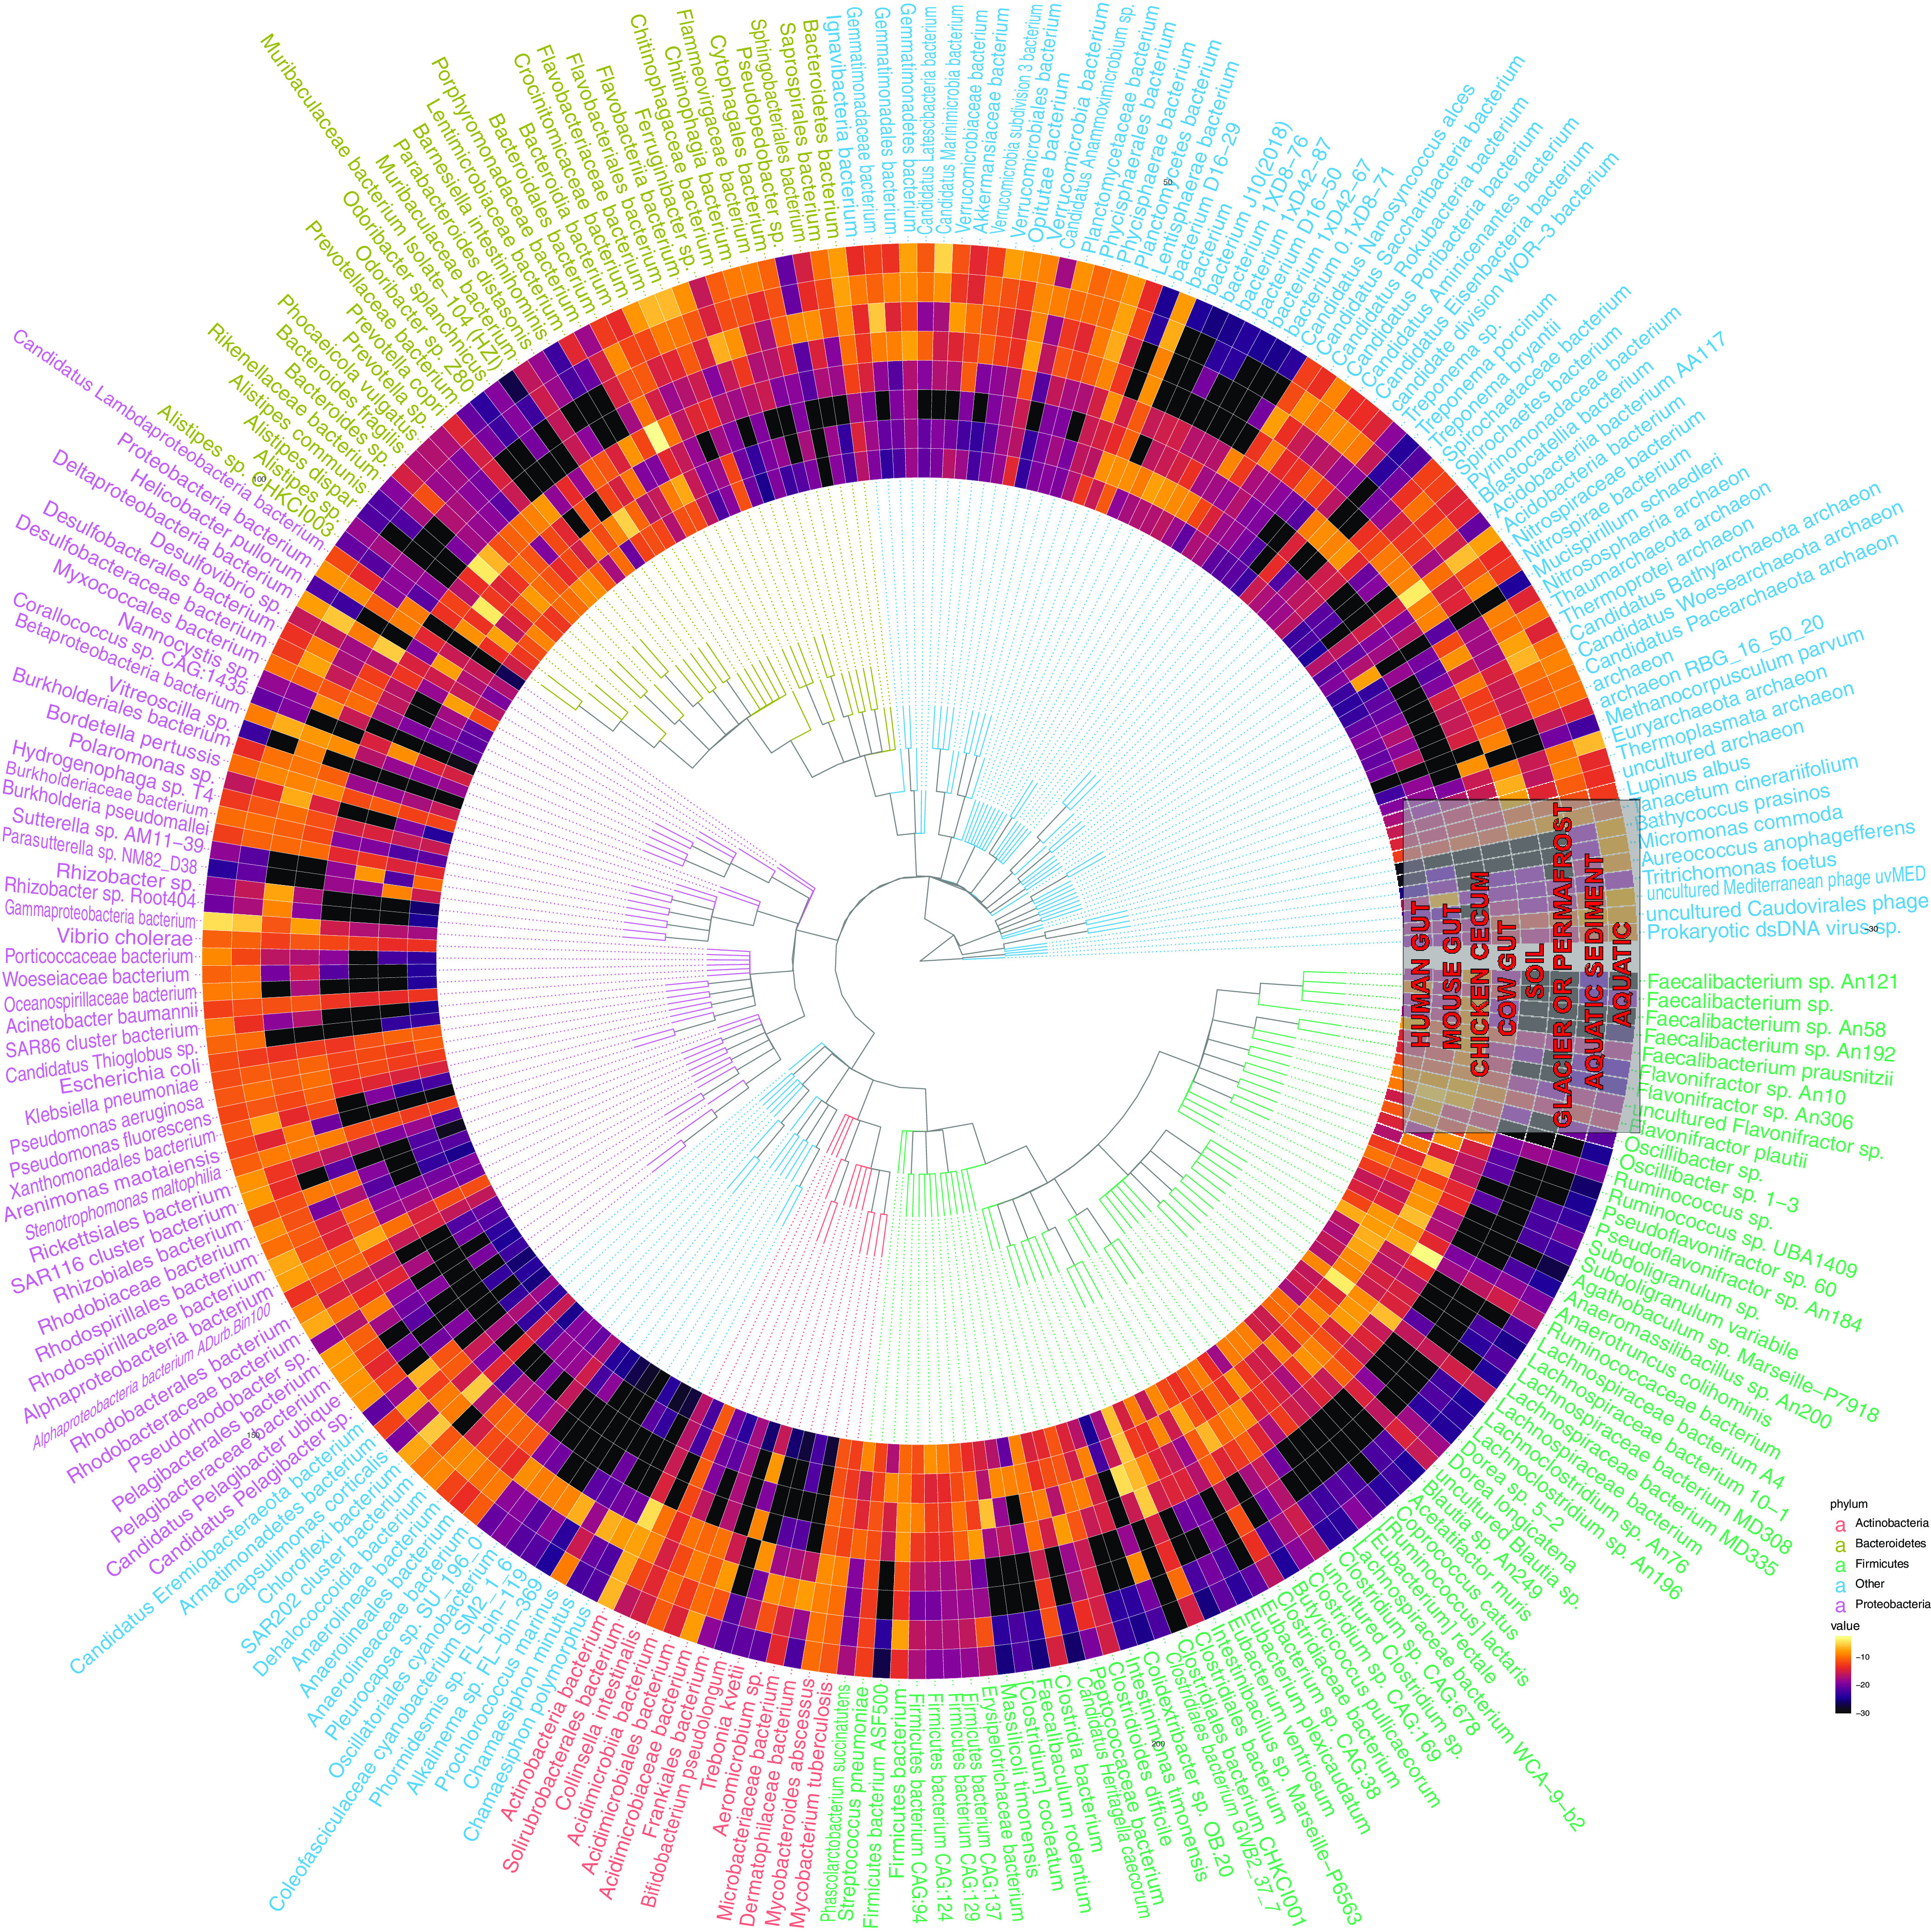
FIG 6.

Taxonomically contextualizing the genetic content of the human gut microbiome. Each ring corresponds to a different ecology. Each “row” corresponds to a different taxonomic annotation for an open reading frame that was abundant in any gut or environment microbiome. The colors correspond to the fractions of all genes with a given annotation that were indicated as abundant in a given ecology. Text color corresponds to phyla.
