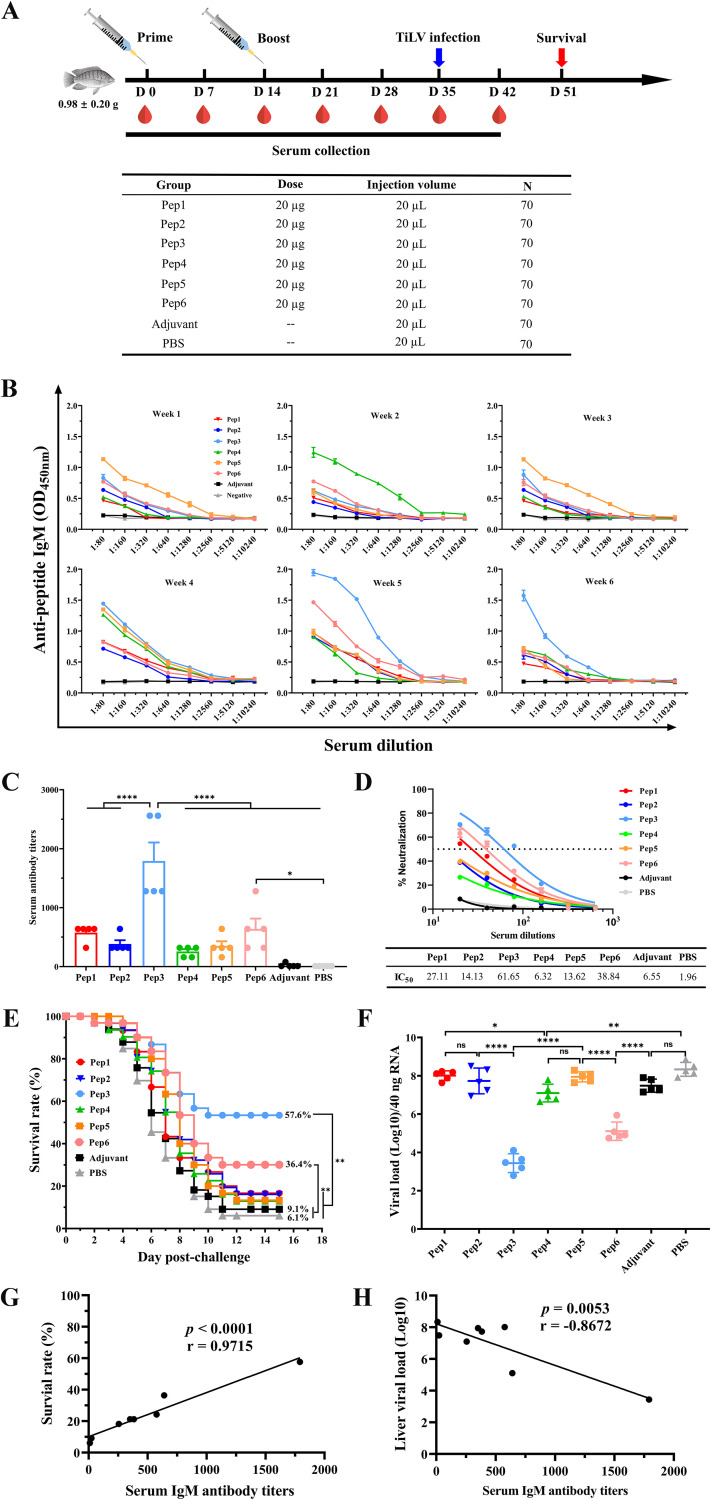
FIG 2.
Synthetic peptides elicited a humoral immune response in tilapia after vaccination. (A) Schematic diagram of tilapia immunization, sample collection, and challenge scheme. Tilapias (70 per group) were vaccinated intraperitoneally with 20 μg per fish of synthetic peptide mixed with Freund’s adjuvant on D0 and D14, respectively. After the prime immunization, blood was collected by broken neck at D7, D14, D21, D28, D35, and D42. On D35, 33 fish were randomly selected for challenge intraperitoneally with 9.0 × 10⁷ copies of TiLV per fish, and the survival rate was calculated for each group at D51. (B) Peptide-specific antibody responses in sera of each group at different time points after vaccination were analyzed by ELISA. Serum samples were serially diluted 2-fold (initial as 1:80), and the peptide-specific antibody response of the serum was measured by the absorbance at 450 nm. Each well was coated with 2 μg of peptide. The values shown are mean absorbance ± SD for each dilution with triplicates. (C) TiLV-specific antibody endpoint titers of different groups of serum at challenge time points (D35) were determined by ELISA, for which plates were coated with TiLV at 6.0 × 10⁴ copies per well. The dilution method for serum was the same as that described for panel B. Endpoint titers of the serum samples are shown as the reciprocal of the highest dilution when the OD450 for samples was ≥2× the OD450 of the negative control. (D) Dose-response neutralization of live TiLV titration curves and IC50 values of serum sample with different vaccination groups at D35. Serum was diluted from 1:20 to 1:640 at a 2-fold ratio, and the test was repeated 3 times per serum sample. Results are expressed as means ± SD. (E) Fish health was monitored daily, and dead fish were collected until day 15 postchallenge. The P values for survival rate are based on a log-rank (Mantel-Cox) test (n = 33). (F) Quantification of TiLV virus in liver tissue on 8 day postchallenge by qRT-PCR. Data are means ± SD (n = 5 per group). (G and H) Correlation between TiLV-specific antibody titers in serum and survival rate within 15 days postchallenge (G) or viral load quantified by qRT-PCR in liver tissue on day 8 postchallenge (H). Positive Pearson correlations were observed between TiLV-specific antibody titers and survival rate (r = 0.9715; P < 0.0001) (G) or inverse Pearson correlation with viral load (r = −0.8672; P = 0.0053) (H). Statistical significance was tested by one-way ANOVA and Tukey’s multiple-comparison tests. ****, P < 0.0001; ***, P < 0.001; **, P < 0.01; *, P < 0.05; ns, no significant difference.

