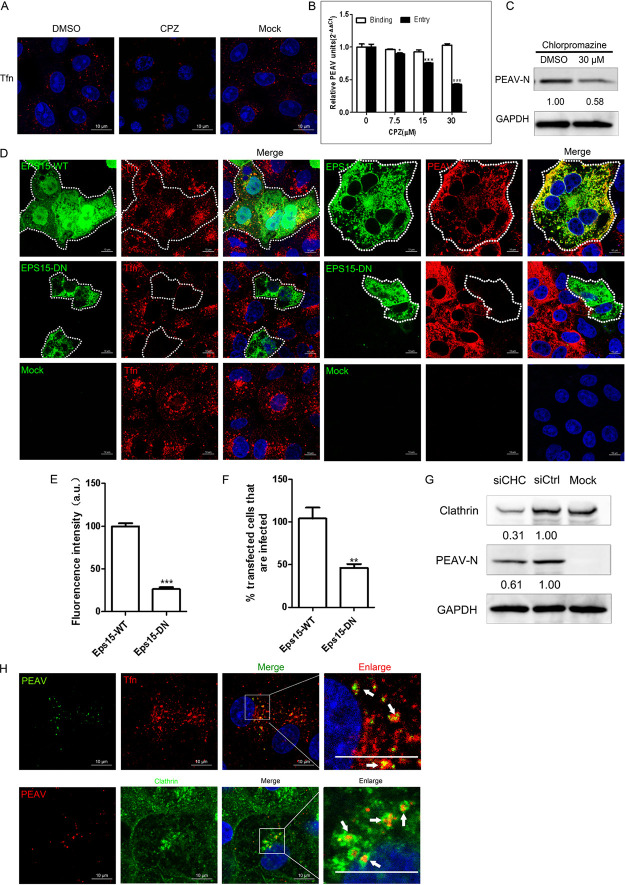
FIG 4.
PEAV entry is clathrin dependent. (A) Vero cells were pretreated with CPZ (30 μM, 15 min, 37°C), followed by incubation with 20 μg/mL Alexa Fluor 568-labeled Tfn (15 min, 37°C). DMSO was used as a negative control, and the uptake of Tfn was measured using confocal microscopy. (B) Vero cells were pretreated with CPZ (15 min, 37°C), followed by inoculation with PEAV (MOI = 1) to allow binding (1 h, 4°C) and entry (1 h, 37°C) in the presence of drugs. (C) In the presence of CPZ (30 μM) (D), cells were inoculated with PEAV (MOI = 5) (2.5 h, 37°C) and immunoblotted to detect the early expression of PEAV N protein. Relative amounts of protein were calculated using ImageJ software. (D) Vero cells were transfected with Eps15 (WT or DN) plasmids (24 h, 37°C), and then incubated with 20 μg/mL Alexa Fluor 568-labeled Tfn (30 min, 37°C) and fixed (4% PFA, 15 min, room temperature) or inoculated with PEAV (MOI = 5) (6 h, 37°C) and fixed (4% PFA, 15 min, room temperature), followed by immunodetection using anti-PEAV N monoclonal antibody. (E) Total fluorescence intensity per cell was calculated in transfected Eps15 DN plasmid cells. (F) Percentage of infected cells observed in WT/DN samples. Over 300 transfected cells were analyzed as described above. (G) Clathrin HC knockdown inhibited PEAV infection. Cells were transfected with siClathrin HC or siCtrl (48 h, 37°C) and inoculated with PEAV (MOI = 5) in the presence of EIPA inhibitors (2.5 h, 37°C), and viral N protein expression was quantified using Western blotting. Relative amounts of protein were calculated using ImageJ software. (H) Vero cells were seeded with PEAV (MOI = 10) (1 h, 4°C), washed, incubated in a maintenance medium with or without 20 μg/mL Alexa Fluor 568-labeled Tfn (15 min, 37°C), and then fixed (4% PFA, 15 min, room temperature). Virions and clathrin were stained with anti-PEAV N and anticlathrin monoclonal antibodies. Confocal microscopy revealed PEAV colocalization with Tfn or clathrin (white arrows). All results are presented as the mean ± SD from three independent experiments (*, P < 0.05; **, P < 0.01; ***, P < 0.001). Scale bar = 10 μm.

