
FIG 3.
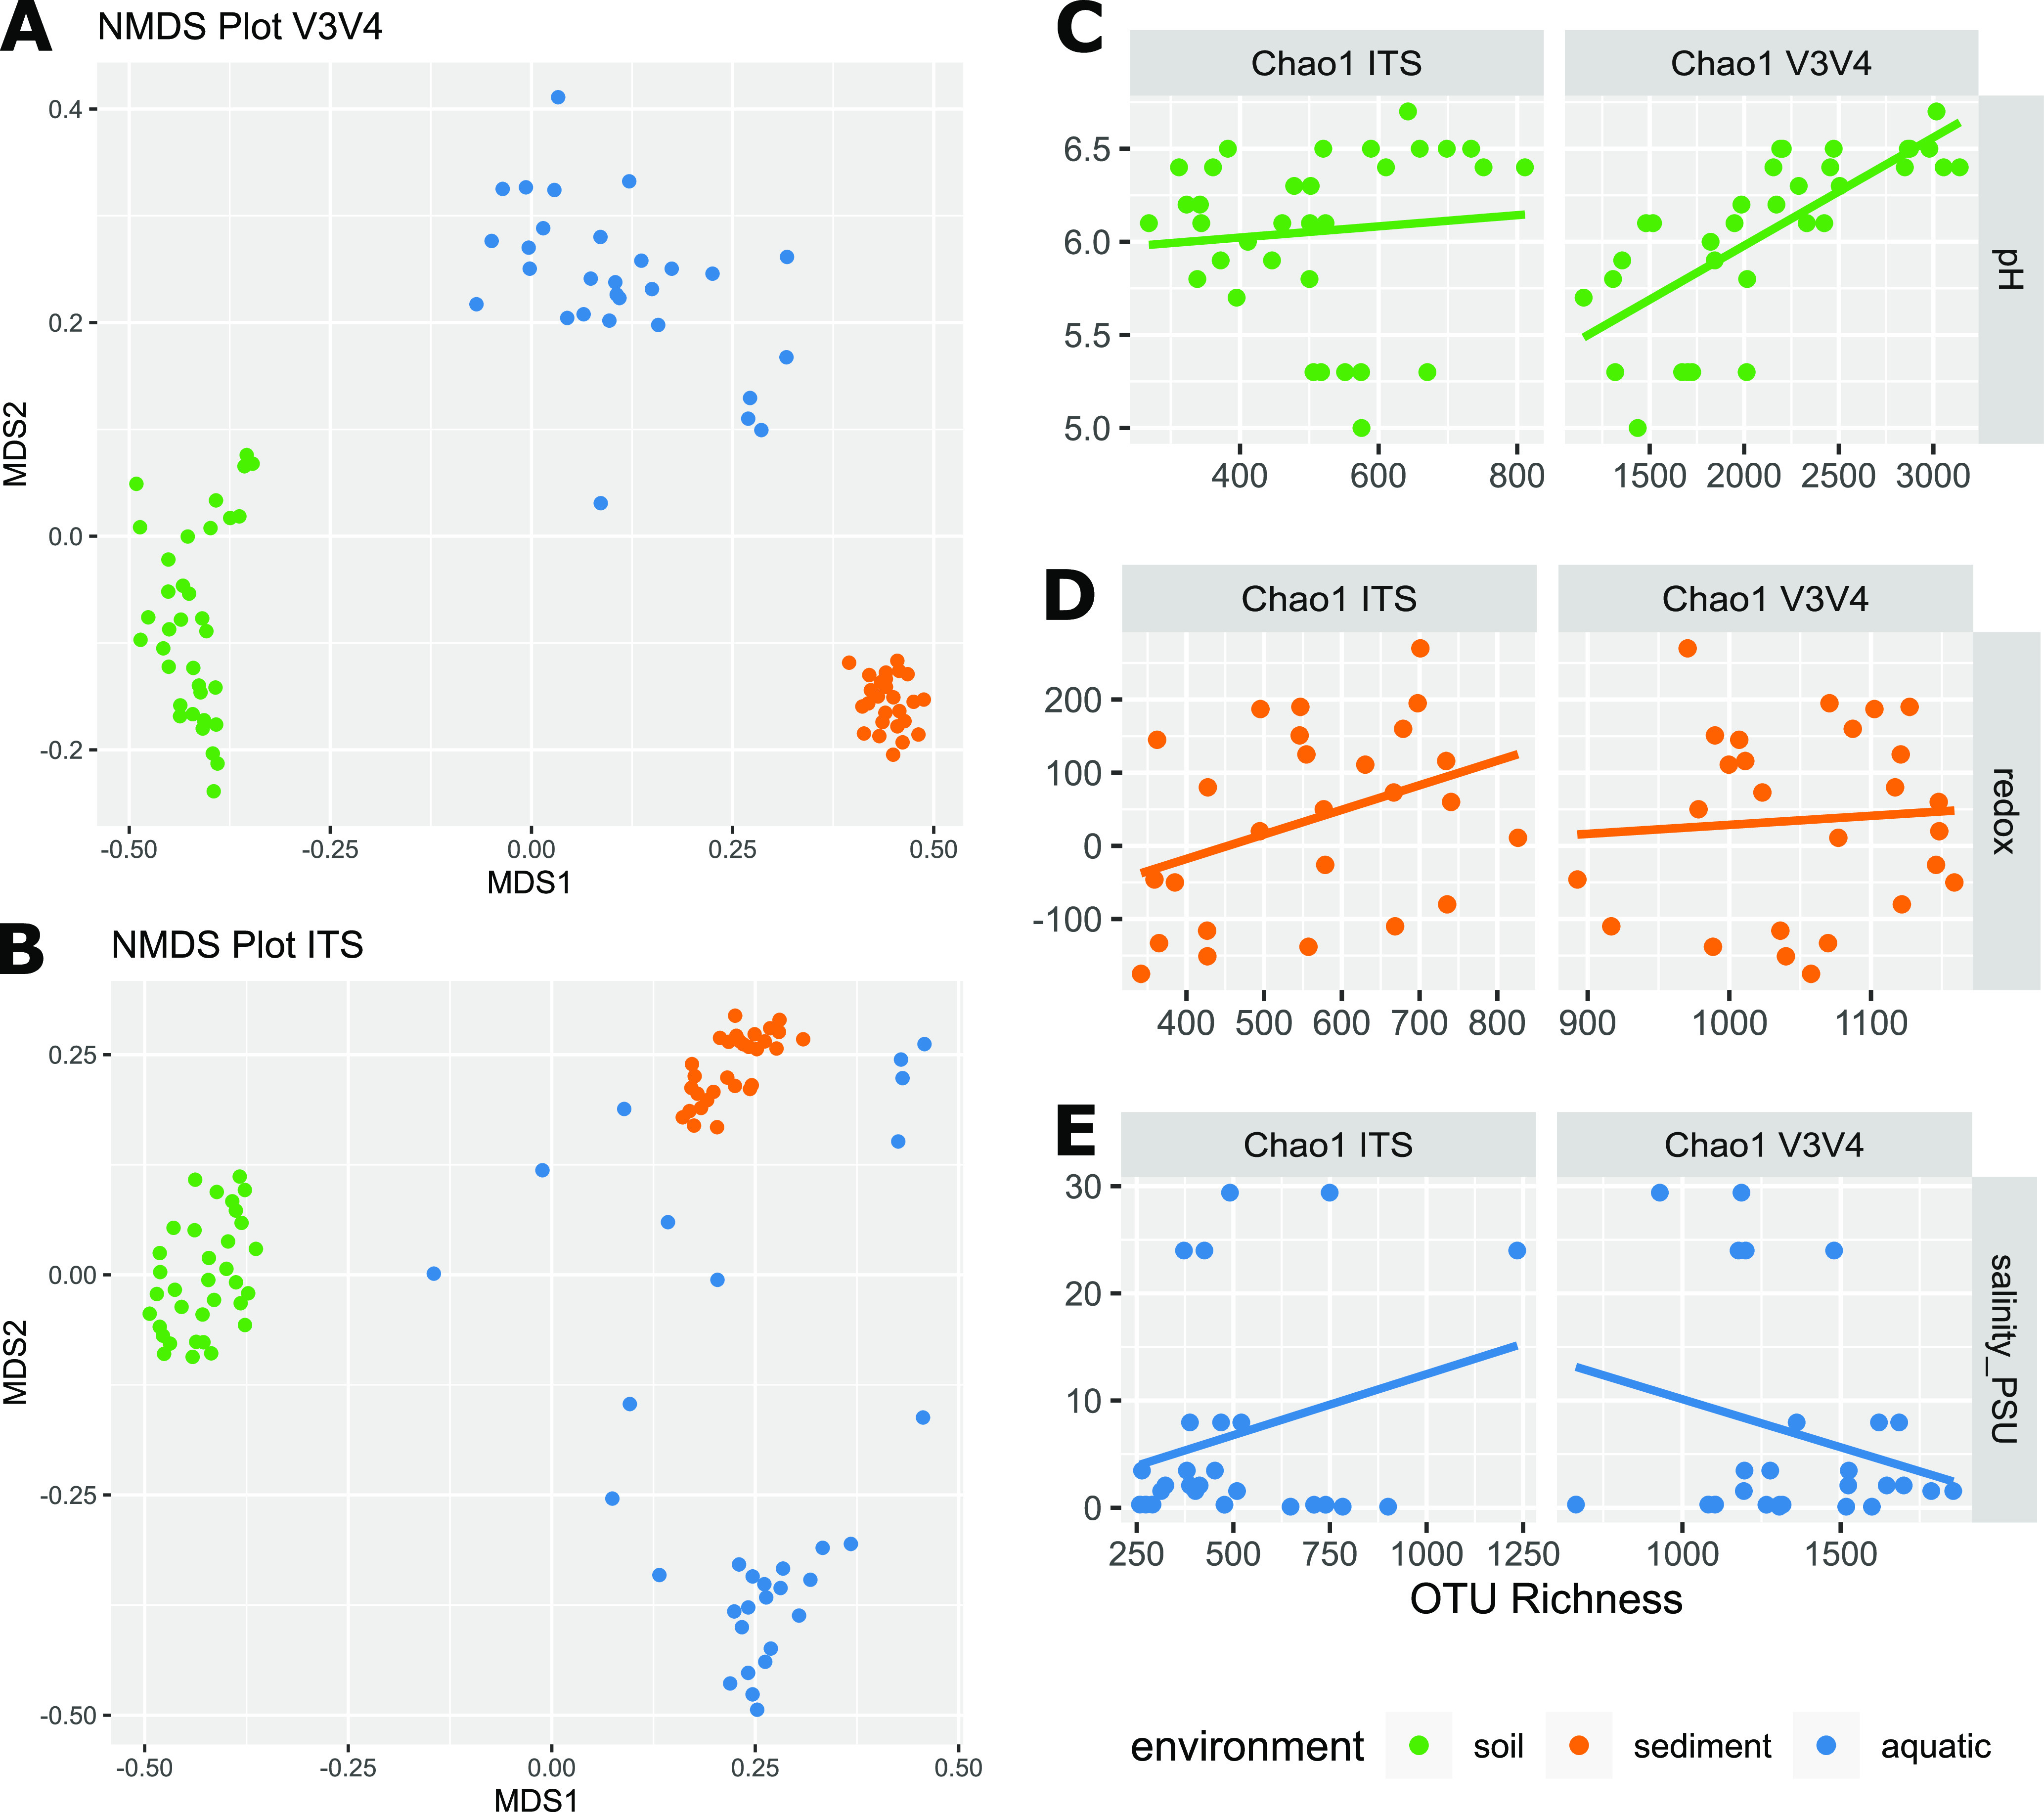
Bacterial and fungal community diversity, and their relation to predominant physicochemical gradients. (A and B) Beta-diversity of the bacterial and fungal taxonomic community composition depicted by non-metric multi-dimensional scaling plots. Soil samples in green, sediment in orange, and aquatic in blue. (C) Estimated fungal and bacterial Chao1 richness in the soil microbiome as a function of pH. (D) Estimated fungal and bacterial Chao1 richness in the sediment microbiome versus the redox potential mVH. (E) Estimated fungal and bacterial Chao1 richness in the aquatic microbiomes versus the salinity PSU. Linear Pearson correlations are indicated with a solid line.