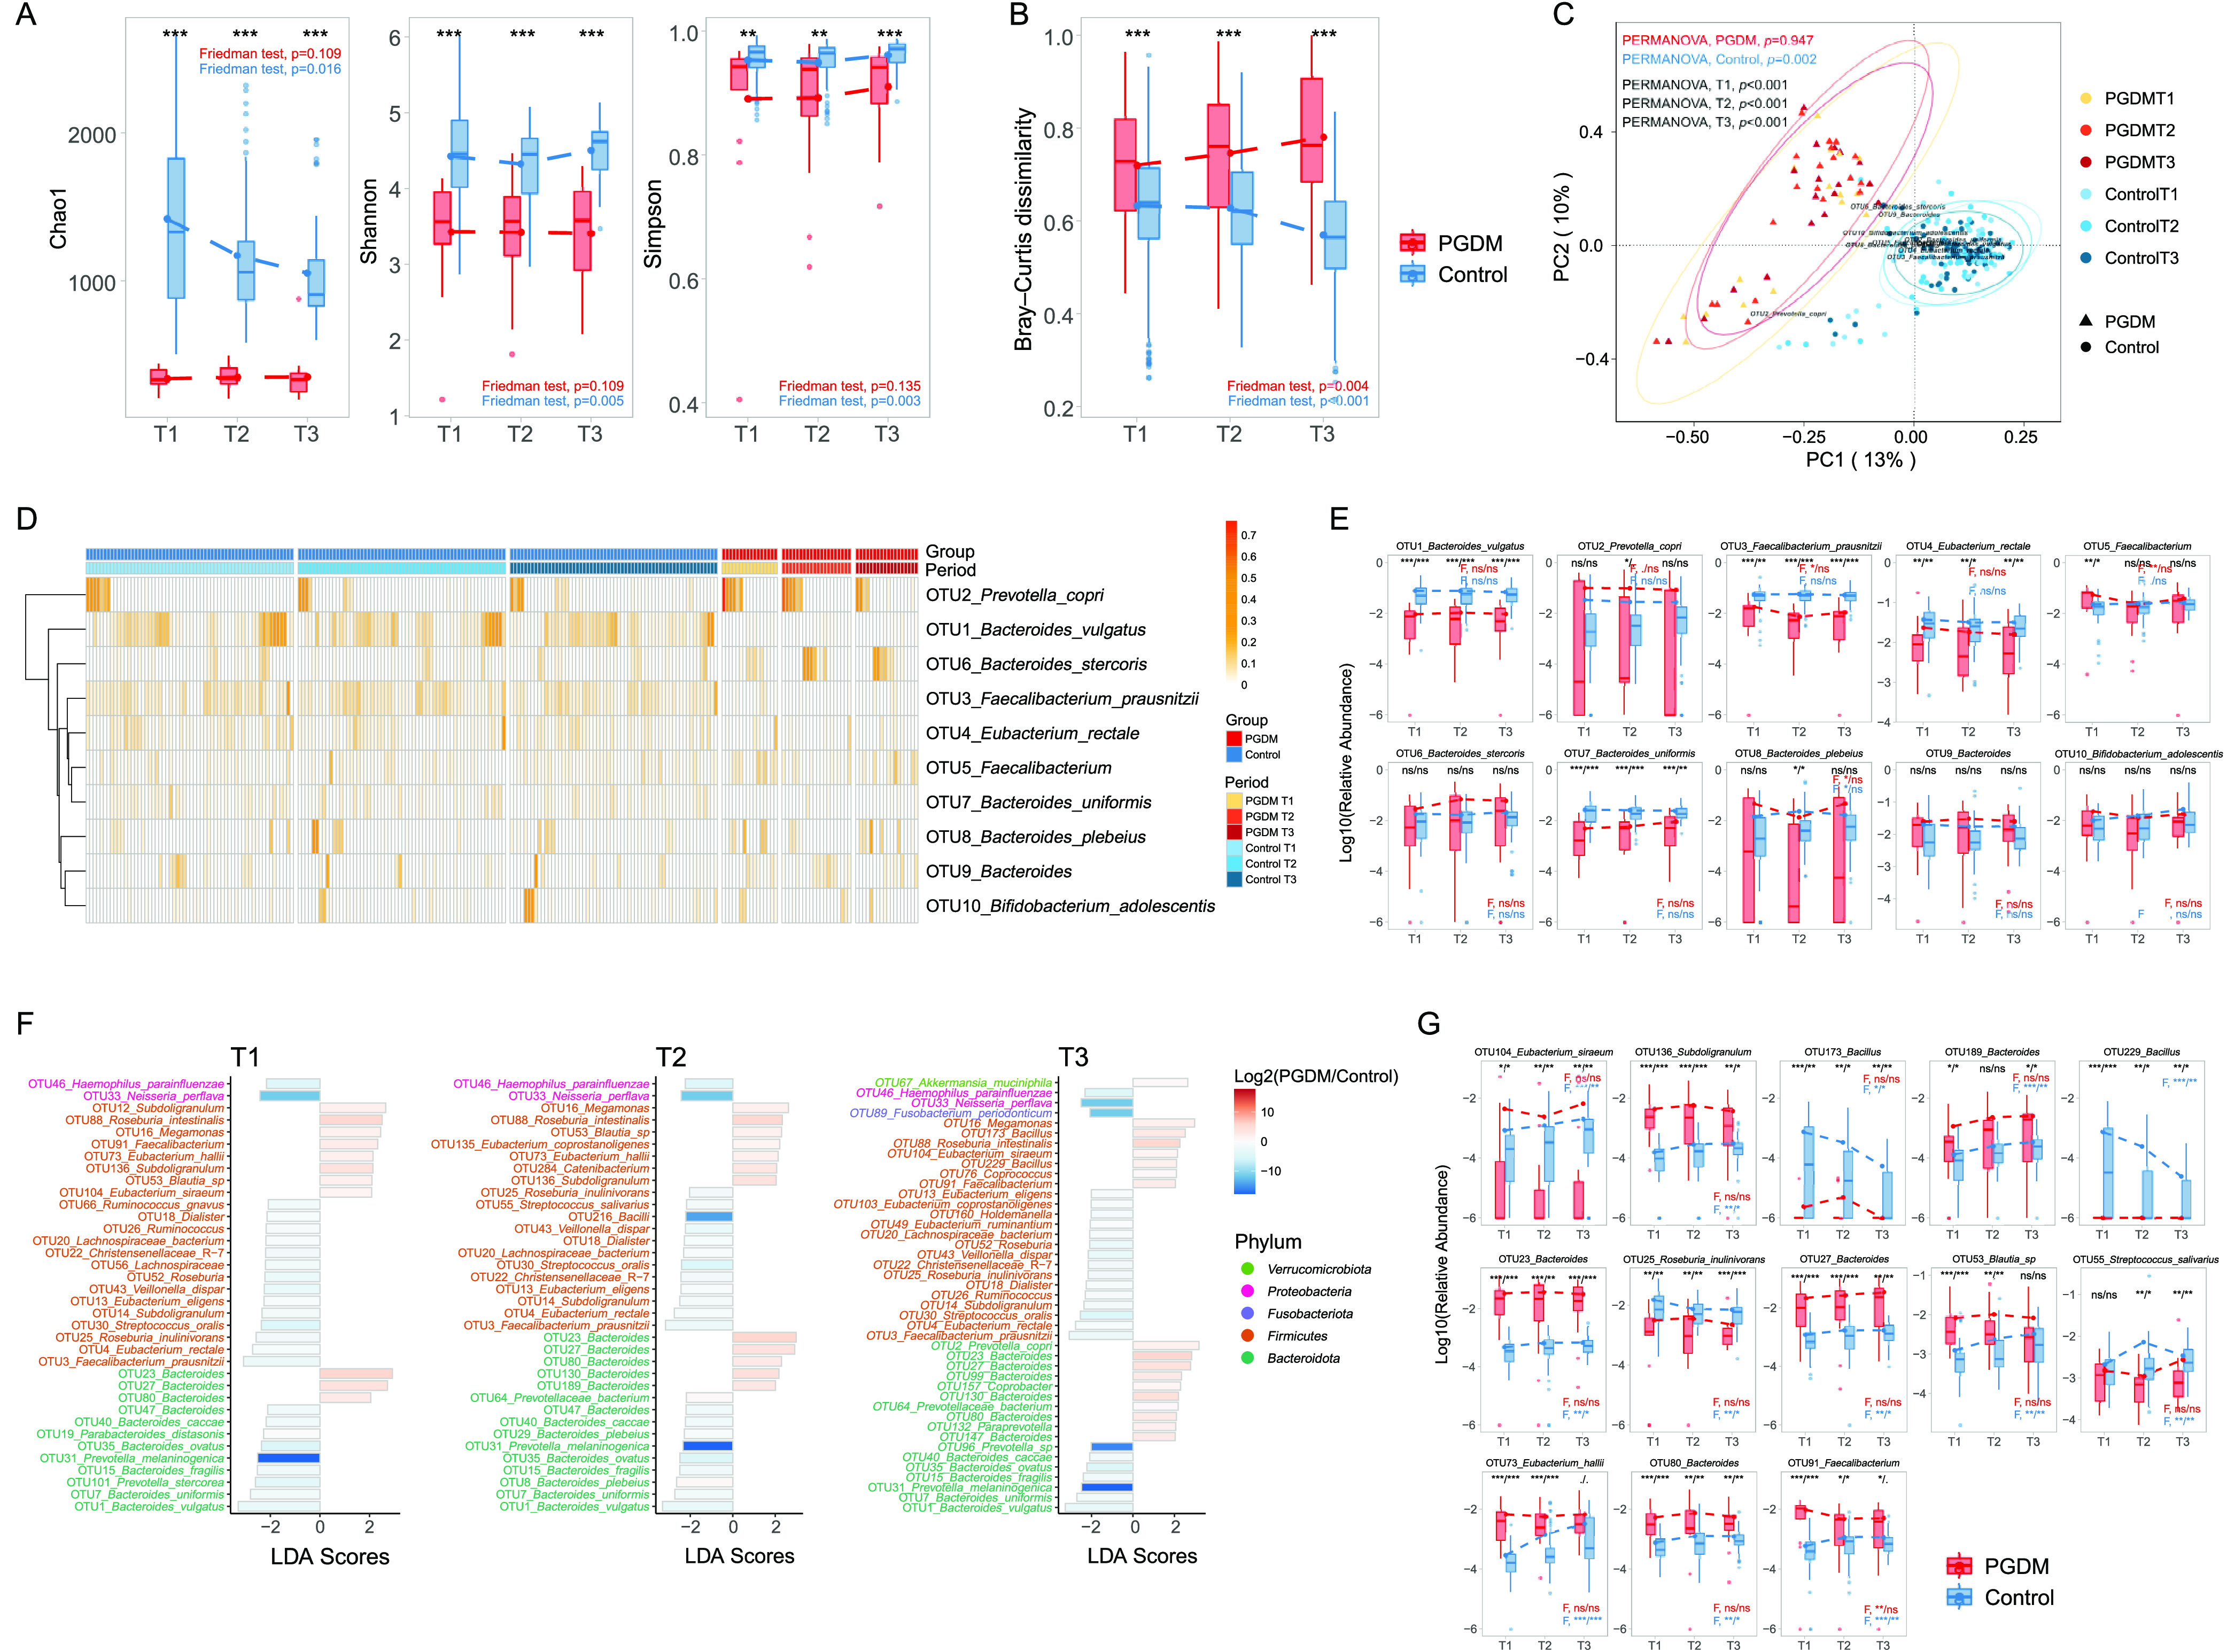
FIG 2.

Gut microbiota composition in pregnant women with or without PGDM. (A) Comparison of alpha diversity indices (Chao1, Shannon, and Simpson) within and between the PGDM (red) and control (blue) groups from T1 to T3. (B) Bacterial community dissimilarities within and between the PGDM (red) and control (blue) groups from T1 to T3. (C) PCoA of the Bray-Curtis dissimilarities of the two groups from T1 to T3; ellipses represent 95% confidence intervals (CIs). (D) Heat map of the top 10 OTUs in both groups in different trimesters. (E) Comparison of the relative abundances of the top 10 OTUs within and between the PGDM (red) and control (blue) groups from T1 to T3. (F) Linear discriminant analysis score of the taxonomic biomarkers for the women with PGDM and healthy controls. The colors of the bars indicate the log2 fold changes in the relative abundances for the taxonomic biomarkers between the women with and without PGDM. The color of the y axis label indicates the phylum of each OTU. (G) Comparison of the relative abundances of the taxonomic biomarkers within and between the PGDM (red) and control (blue) groups from T1 to T3. The dotted line of the graph with each box plot represents the average. F, Friedman test. Significances based on P and Q values are separated by a slash. ns, not significant (P or Q > 0.1); *, P or Q < 0.05; **, P or Q < 0.01; ***, P or Q < 0.001.
