
FIG 3.
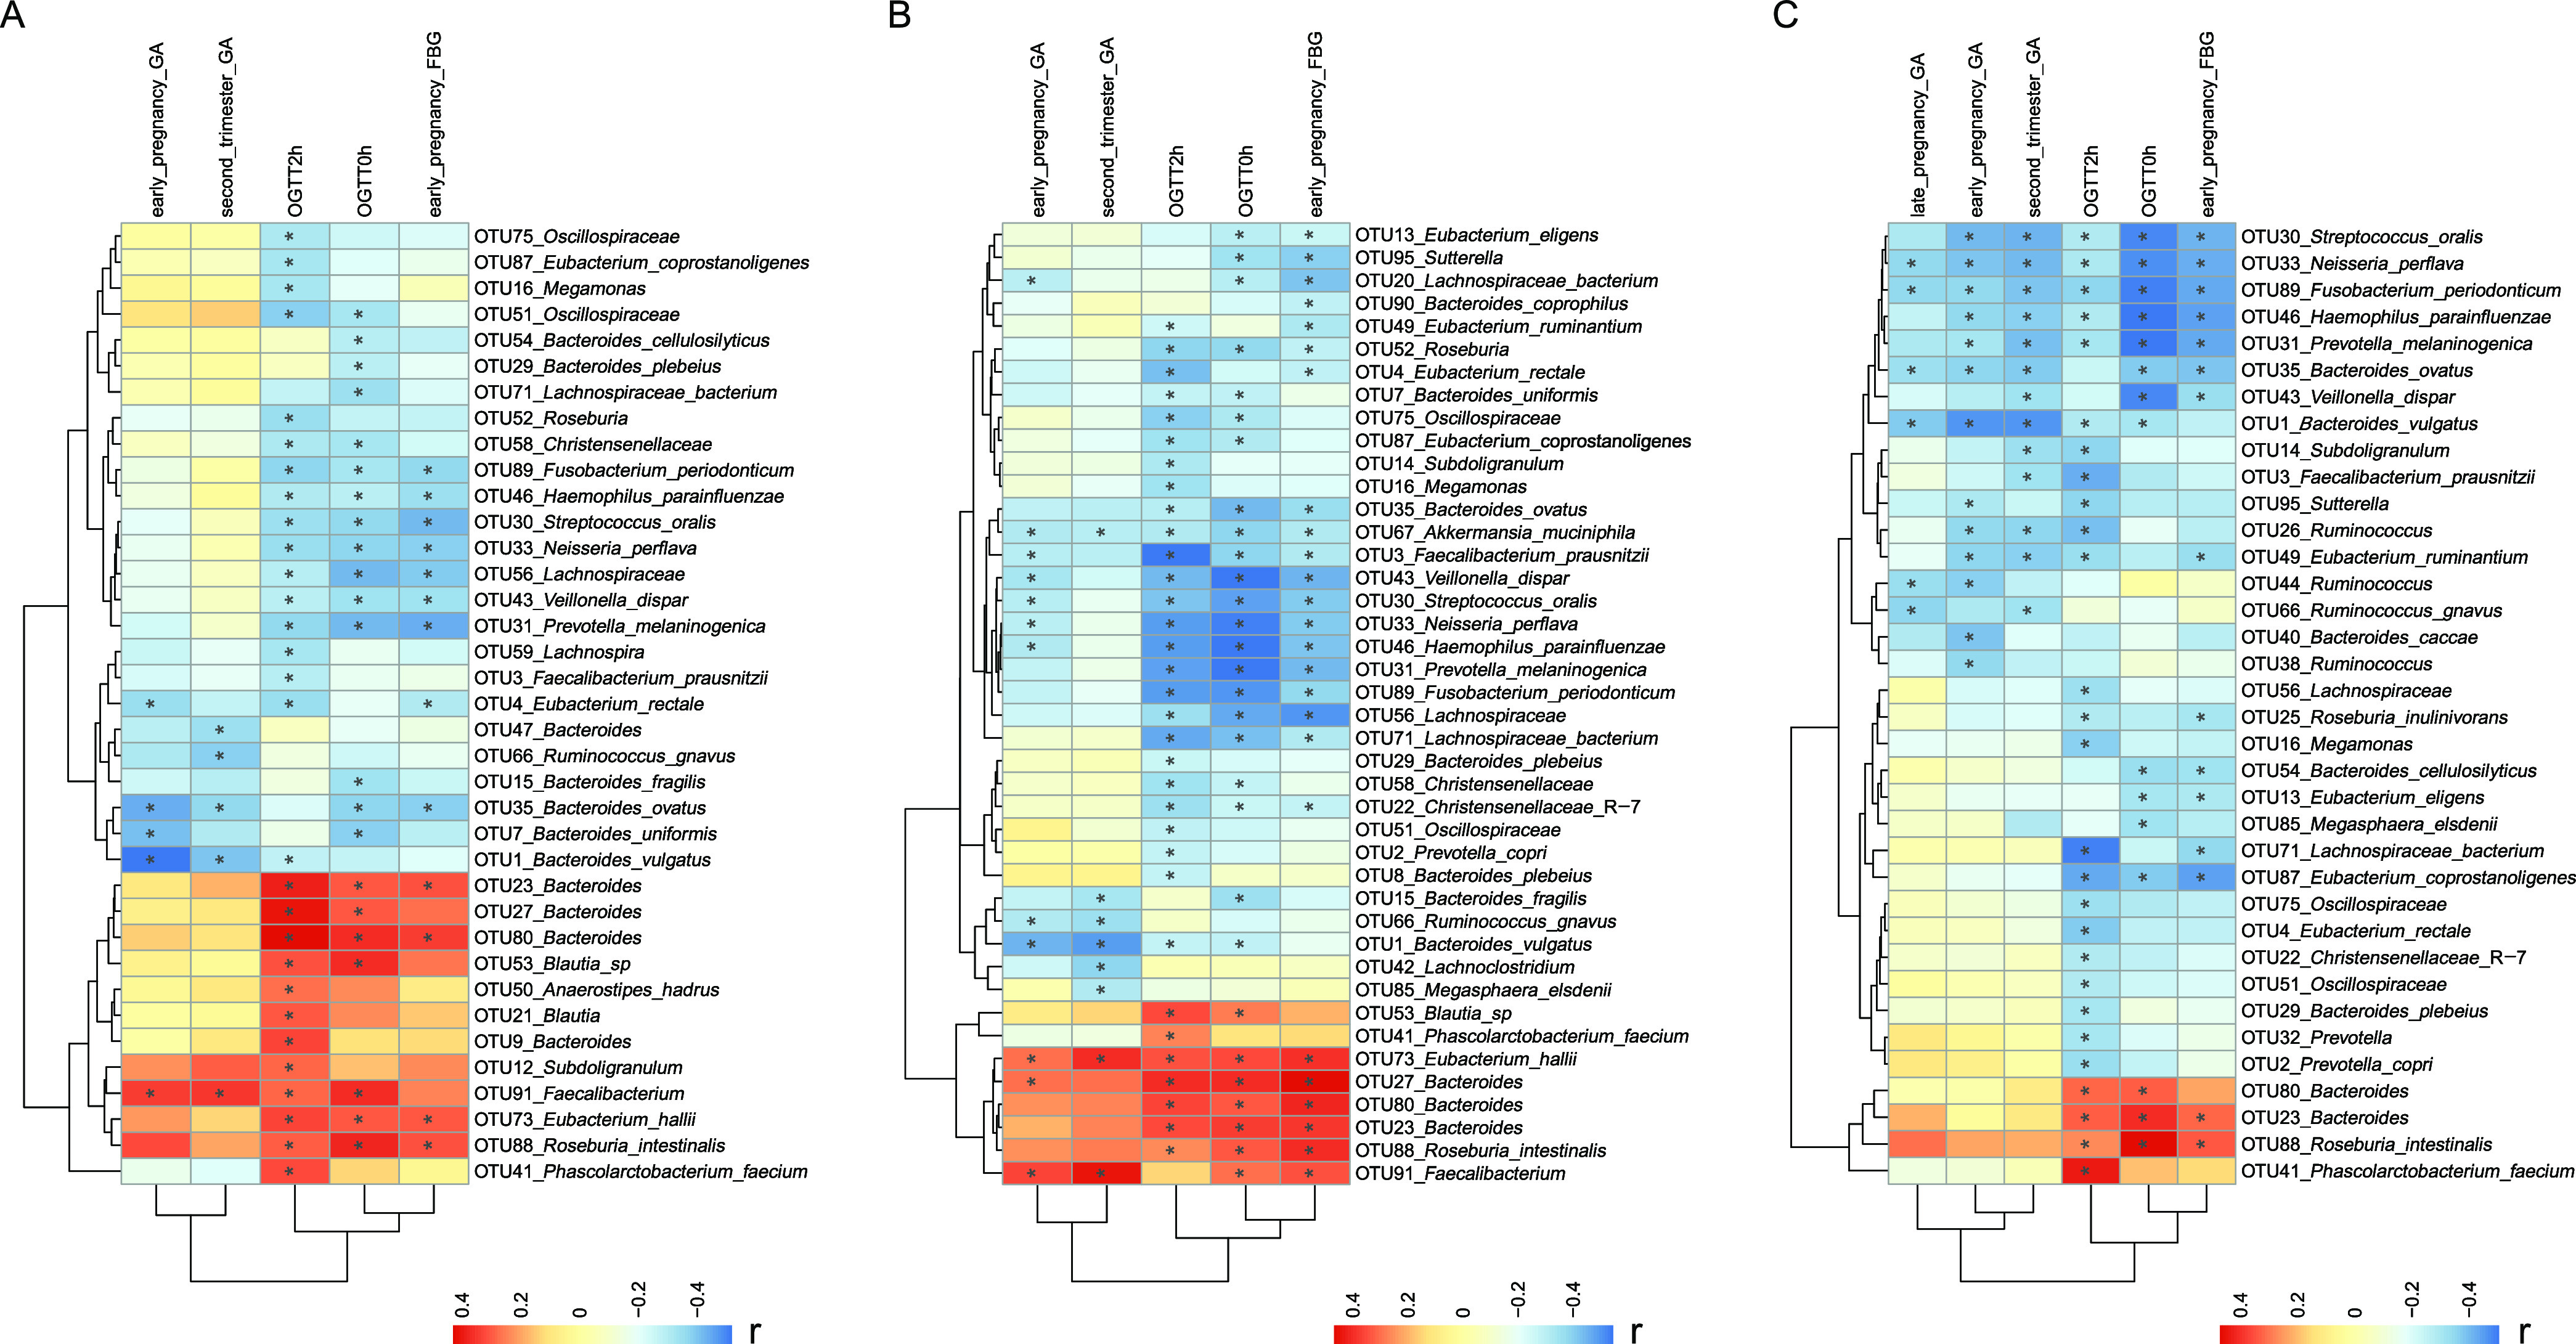
Spearman’s rank correlation heat map of specific OTUs and clinical indices regardless of PGDM status in the first (A), second (B), and third (C) trimesters. Features that have at least one significant sign are shown. The colors of the cells represent the r value of the correlation coefficient. *, P < 0.05.