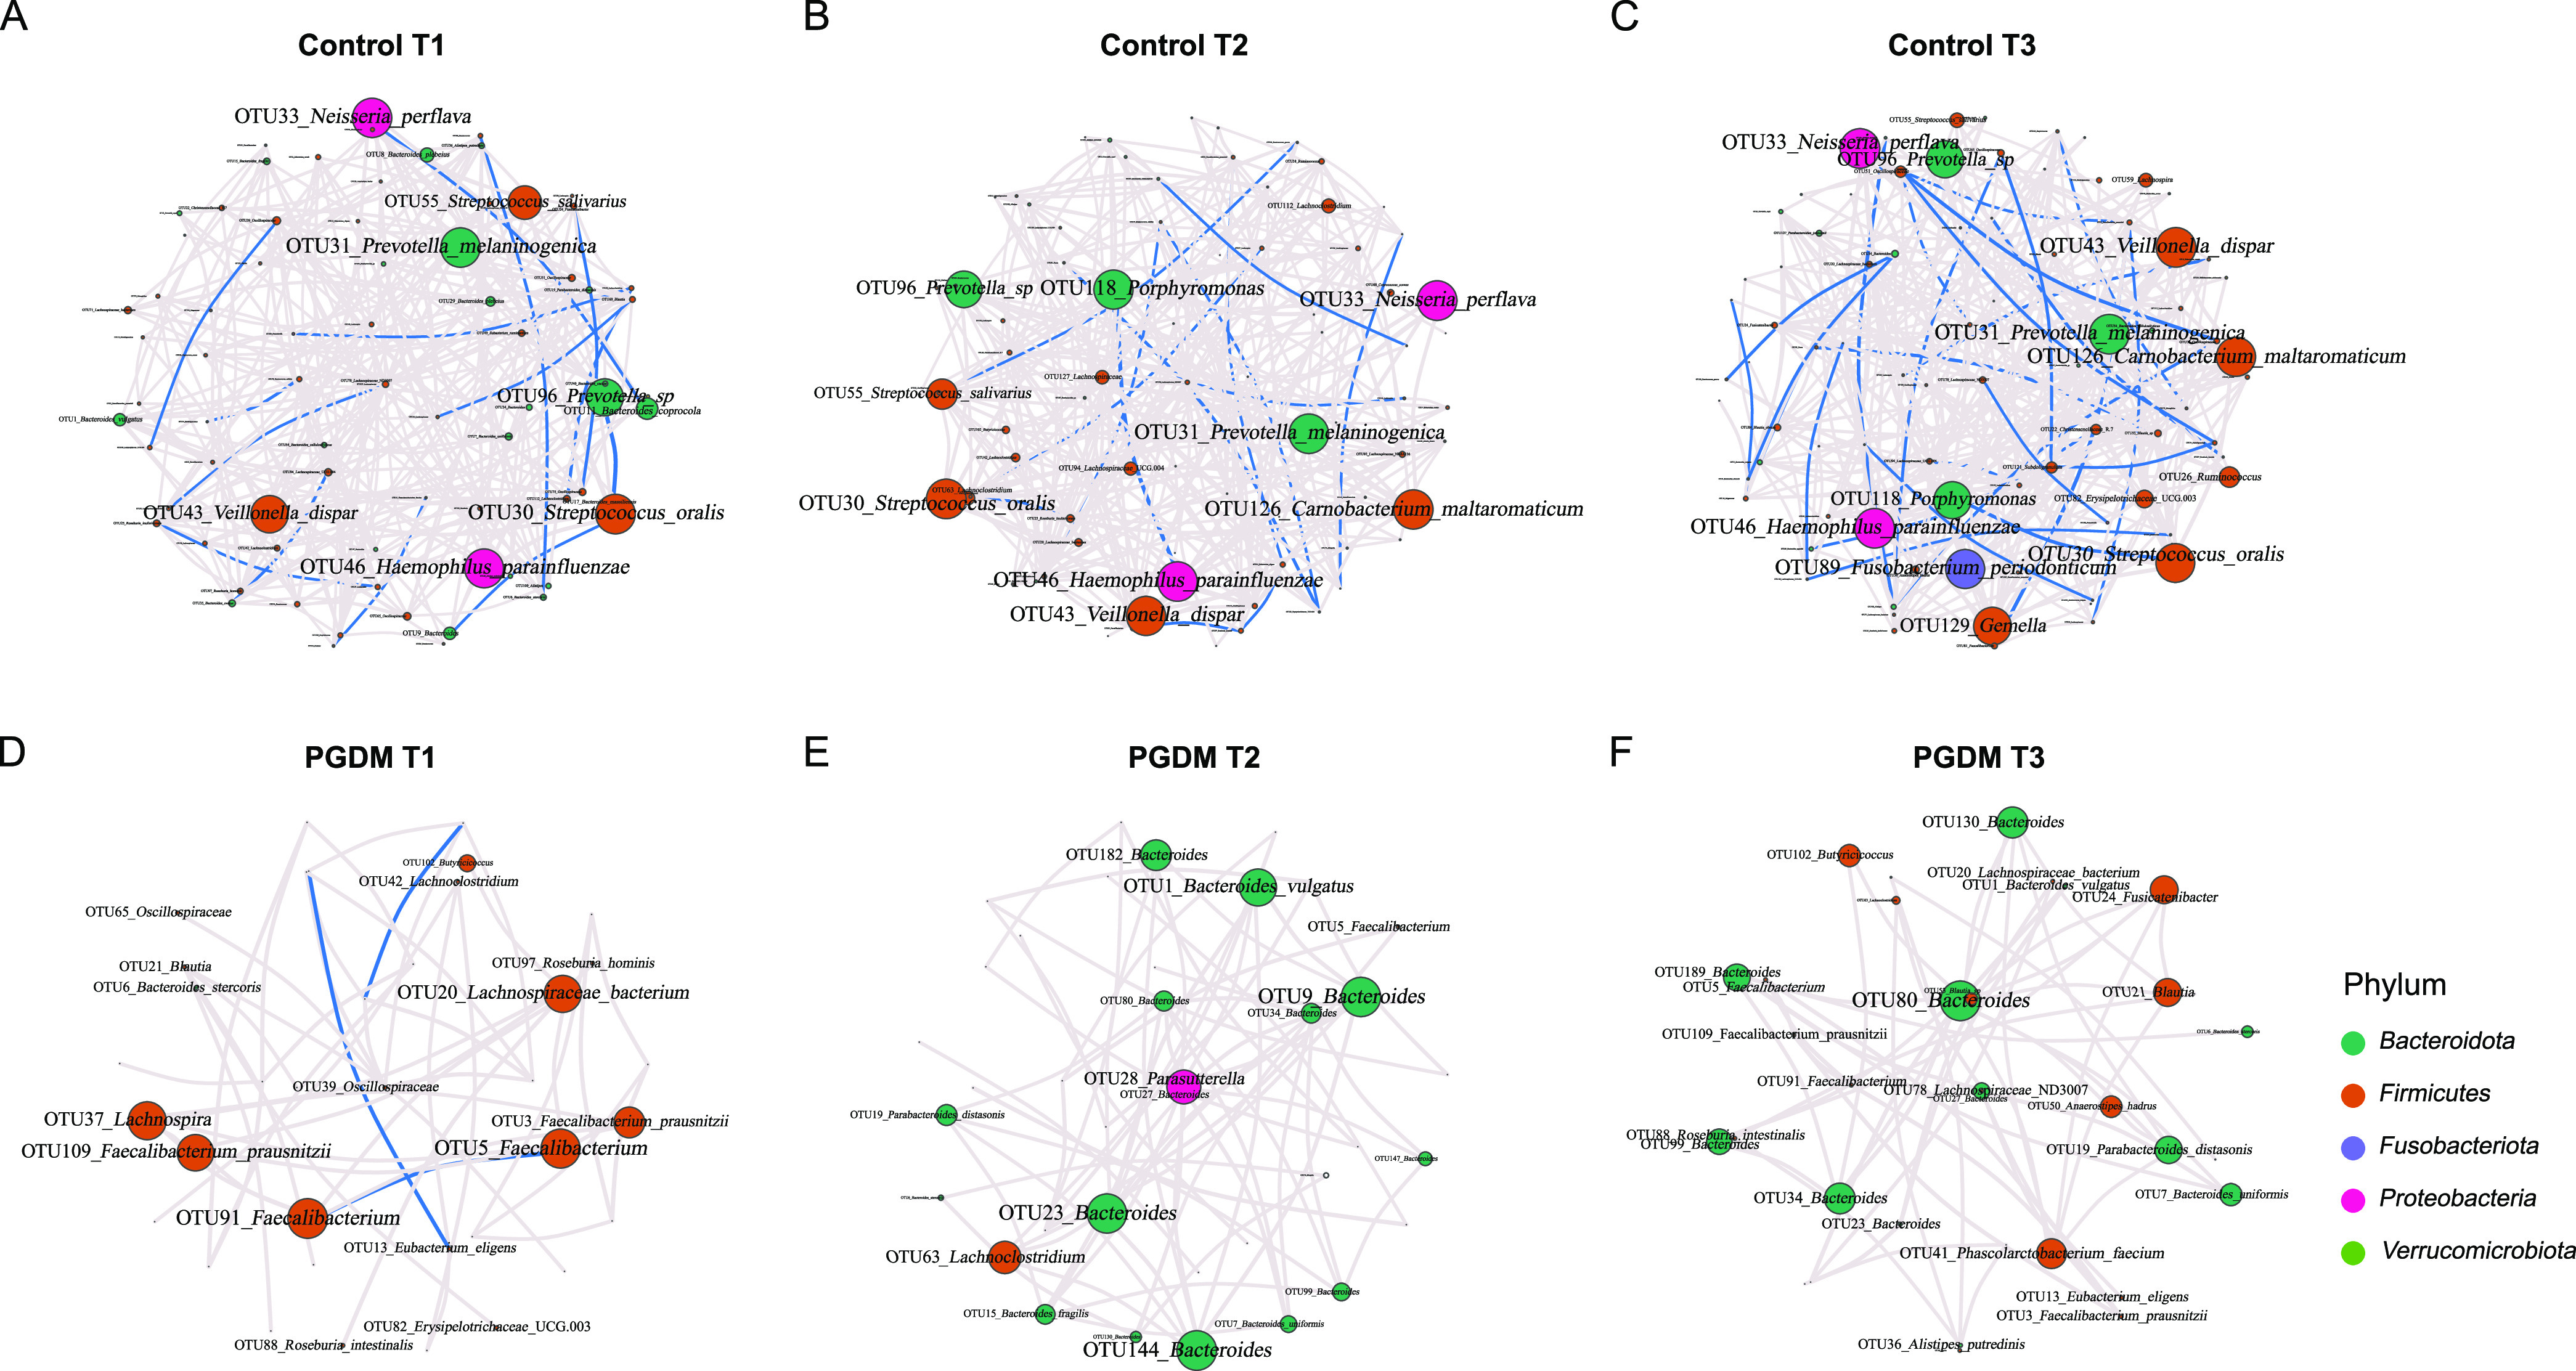
FIG 4.

Gut microbial networks in pregnant women with or without PGDM in different trimesters. (A to C) Control group from T1 to T3. (D to E) PGDM group from T1 to T3. Nodes represent OTUs; the sizes indicate the eigenvector centrality, and the colors indicate the phylum of each OTU. Edges represent microbial correlations; gray and blue indicate positive and negative correlations, respectively. Edge thickness indicates correlation strength, and only the high-confidence interactions (Q < 0.05) with high absolute correlation coefficients (>0.3) are presented.
