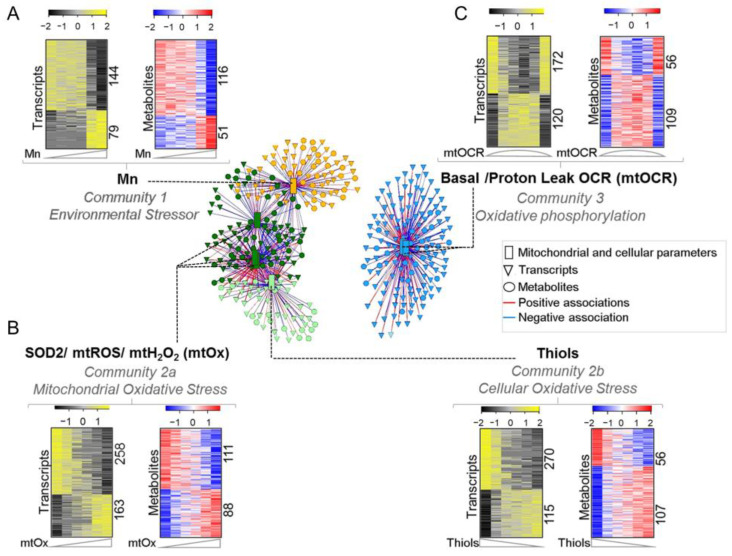
Figure 1.
Data-driven integrative analysis defined 3 communities with transcriptome and metabolome interaction with mitochondrial-cellular parameters [MCP] in response to Mn dose. Three major communities generated through PLS regression method for pairwise data integration using xMWAS v0.54 at |r| > 0.9. (A) Community 1 (yellow)—environmental stressor subnetwork comprising intracellular Mn positively associated with 79 genes and 51 metabolites and negatively associated with 144 genes and 116 metabolites. (B) Community 2 (green)—oxidative stress subnetwork further bifurcated into two sub-communities at |r| > 0.8—communities 2a and 2b. Community 2a (dark green)—mitochondrial oxidative stress (mtOx) subnetwork community comprising SOD2, mtROS and mtH2O2 positively associated with 163 genes and 88 metabolites and negatively associated with 268 genes and 111 metabolites. Community 2b (light green)—cellular oxidative stress subnetwork comprising total cellular thiols positively associated with 270 genes and 56 metabolites and negatively associated with 115 genes and 107 metabolites. (C) Community 3 (blue)—oxidative phosphorylation subnetwork (mtOCR) comprising basal OCR and proton leak dependent OCR, positively associated with 120 genes and 109 metabolites and negatively associated with 172 genes and 56 metabolites. Seven MCPs are represented as rectangles, genes as triangles and metabolites as circles. Red edges represent positive, while blue represents negative associations with their respective MCPs. |r| > 0.8, p < 0.05.

