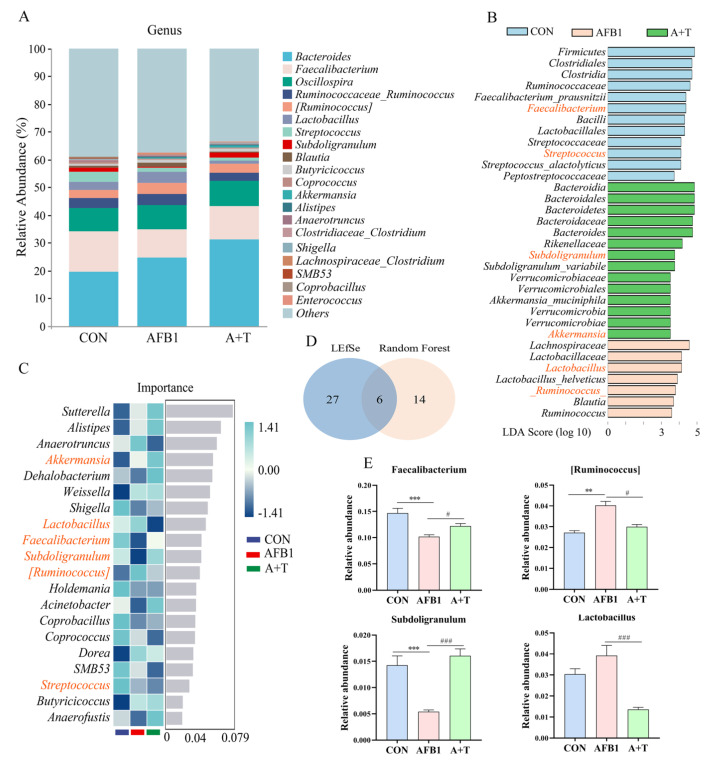
Figure 2.
TFRD protects against AFB1–induced abnormal changes in the gut microbiota at the genus level. (A) Relative abundance of gut microbial composition at the genus level (top 20). (B) The differential genera screened by LEfSe analysis and random forest analysis were analyzed by Venn diagram, and the coincidence part was the significantly different genera. Blue indicates CON group, red indicates AFB1 group, and green indicates A + T group. (C) Random forest analysis (top 20 in importance). Blue indicates CON group, red indicates AFB1 group, and green indicates A + T group. (D) Venn diagram analysis of differential genera. (E) Four genera changed significantly in the overlap of the Venn diagram. Differences between groups were analyzed by One–way ANOVA. The presented values are the mean ± SEM (n = 6). Differences were considered significant at (**) p < 0.01, and (***) p < 0.001 compared to the CON group and at (#) p < 0.05, and (###) p < 0.001 compared to the AFB1 group.

