Figure 6.
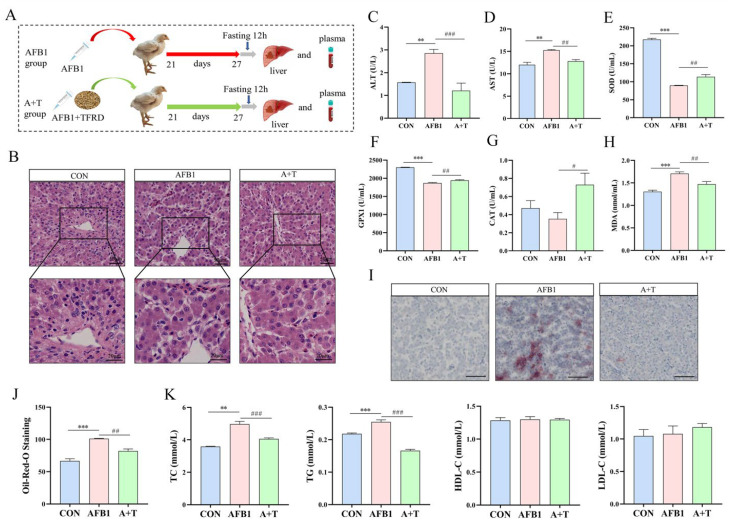
TFRD improves AFB1-induced liver injury. (A) To evaluate liver performance, broilers were treated with an ingluvies injection of AFB1 or feed supplemented with TFRD. (B) Hematoxylin and eosin (HE) staining of liver tissue. Scale bar = 50 μm for 20× magnification; scale bar = 20 μm for 40× magnification. (C,D) Plasma alanine aminotransferase (ALT) and aspartate aminotransferase (AST) activity. (E–H) Plasma antioxidant enzyme superoxide dismutase (SOD), glutathione peroxidase 1 (GPX1), catalase (CAT) activities, and oxidation product malondialdehyde (MDA) levels. (I) Oil Red O (ORO) staining of liver tissue (scale bar = 100 μm for ×10 magnification). (J) The lipid droplet number of the liver with oil red O staining. (K) The levels of plasma total cholesterol (TC), triglyceride (TG), high-density lipoprotein cholesterol (HDL-C), and low-density lipoprotein cholesterol (LDL-C). Differences between groups were analyzed by One-way ANOVA. The presented values are the mean ± SEM (n = 6), Differences were considered significant at (**) p < 0.01 and (***) p < 0.001 compared to the CON group and at (#) p < 0.05, (##) p < 0.01, and (###) p < 0.001 compared to the AFB1 group.

