Figure 7.
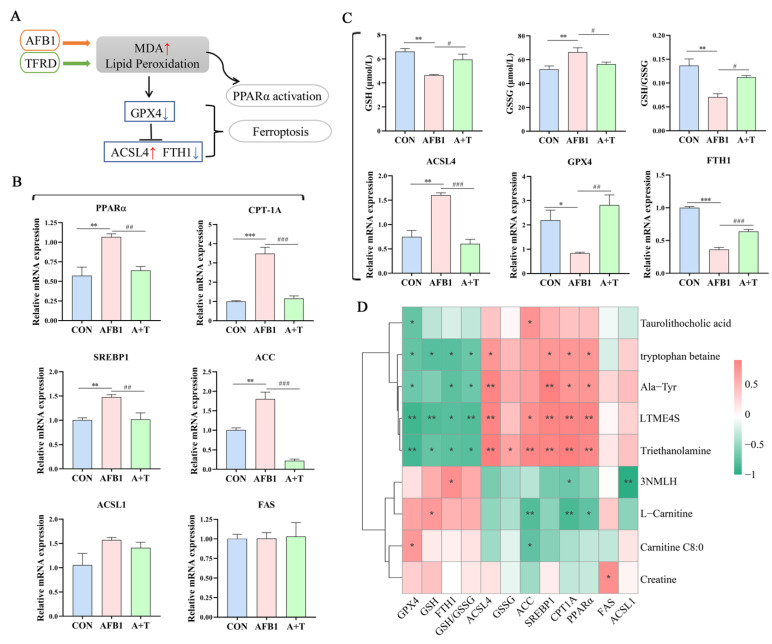
TFRD ameliorates AFB1-induced hepatic ferroptosis and abnormal lipid metabolism. (A) Lipid peroxidation promotes ferroptosis and PPARα activation. (B) The mRNA expression levels of key lipid metabolism genes (PPARα, CPT-1A, SREBP1, ACC, FAS, and ACSL1) in liver. (C) Plasma GSH and GSSG levels, the GSH/GSSG ratio, and the mRNA expression levels of key ferroptosis genes (ACSL4, GPX4, and FTH1) in liver. GSH, glutathione; GSSG, oxidized glutathione. Differences between groups were analyzed by One-way ANOVA. The presented values are the mean ± SEM (n = 6). Differences were considered significant at (*) p < 0.05, (**) p < 0.01, and (***) p < 0.001 compared to the CON group and at (#) p < 0.05, (##) p < 0.01, and (###) p < 0.001 compared to the AFB1 group. (D) Association analysis of key ferroptosis parameters and lipid metabolism genes with marker differential metabolites by Pearson correlation. The asterisks (* p < 0.05, and ** p < 0.01) indicate statistically significant correlations. 3NMLH, 3-N-Methyl-L-Histidine; LTME4S, L-tyrosine methyl ester 4-sulfate.

