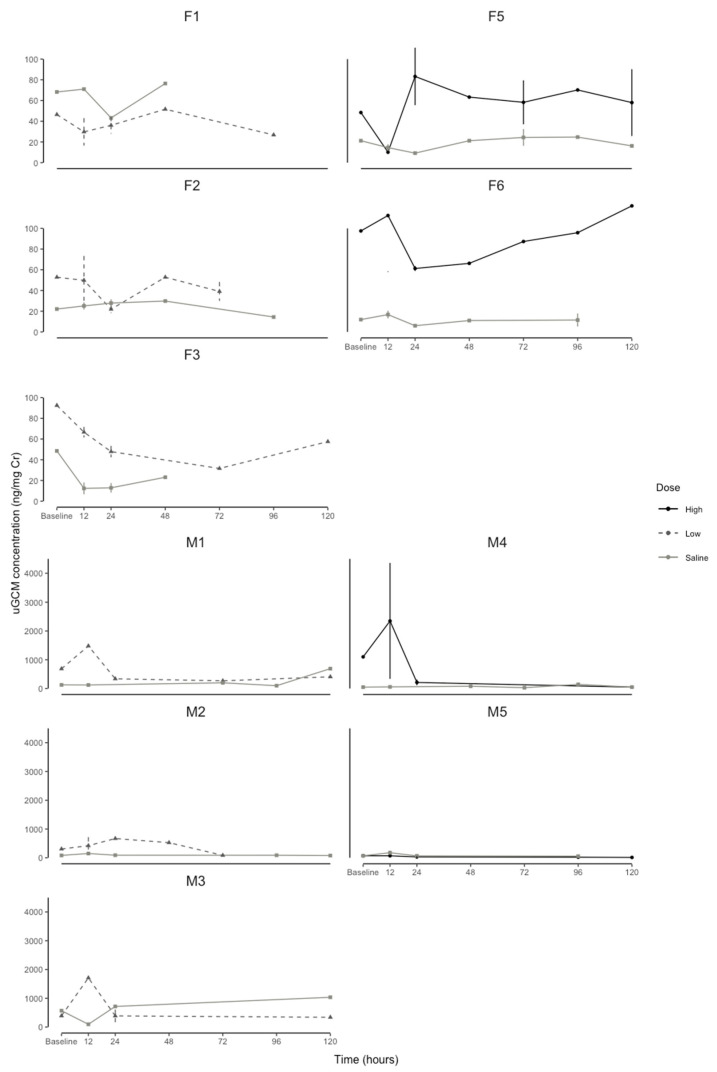
Figure 3.
Individual naked mole-rat (Heterocephalus glaber) urine glucocorticoid metabolite concentration (uGCM, ng/mg creatinine) profiles of baseline (before and 48 h after administration) high dose of ACTH (60 μg/100 g body mass), low dose of ACTH (20 μg/100 g body mass), and saline (200 µL sterile physiological saline: control) for 5 males (M1, M2, M3, M4, M5) and 5 females (F1, F2, F3, F5, F6) at each time interval. One male (M6) and one female (F4) excluded due to small sample size. Points = mean, whiskers = standard error.

