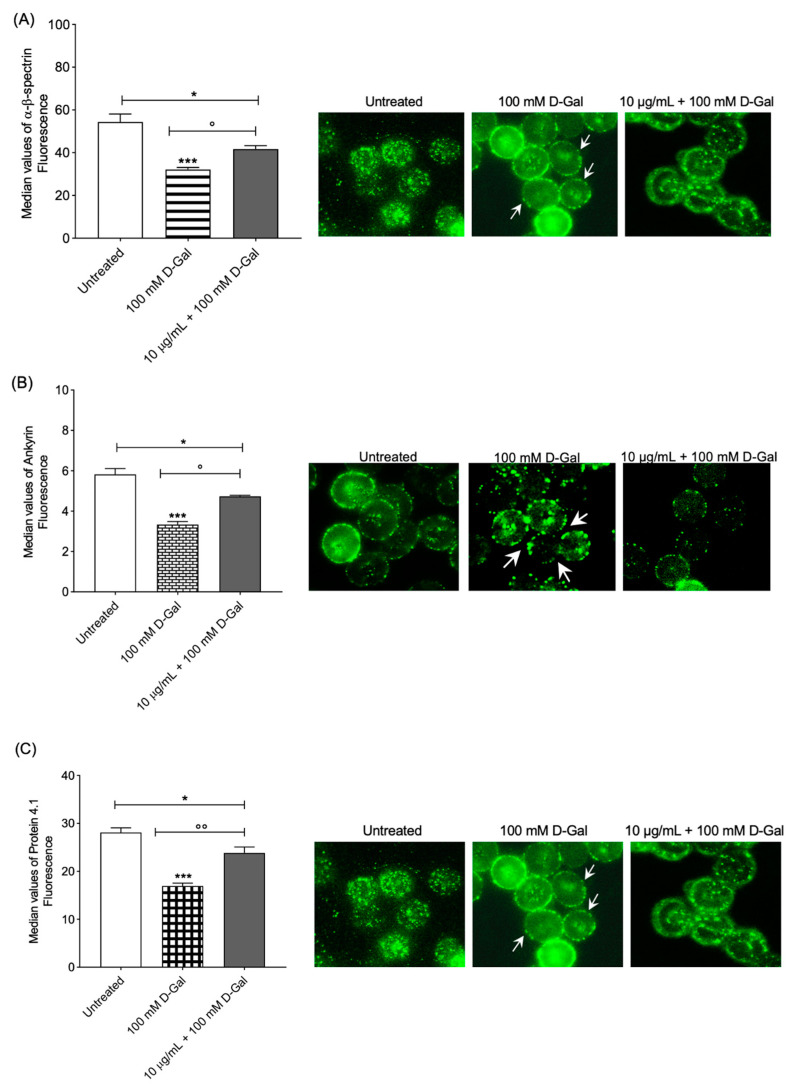
Figure 3.
(A) Analysis using flow and static cytometry of α- and β-spectrin expression. Red blood cells were treated for 24 h with 100 mM d-Gal, with or without pre-incubation for 1 h with 10 µg/mL Açaì extract. Bars represent fluorescence intensity values. In panel (A) (right), representative images of α- and β-spectrin levels obtained using immunofluorescence are reported. Samples were observed with a 100× objective. Note the morphological changes in 100 mM d-Gal (arrows). * p < 0.05 control; *** = p < 0.001 control; ° = p < 0.05 versus 100 mM d-Gal; n = 4. (B) Analysis using flow and static cytometry of ankyrin expression. Red blood cells were treated for 24 h with 100 mM d-Gal, with or without pre-incubation for 1 h with 10 µg/mL Açaì extract. Bars represent fluorescence intensity values. In panel (B) (right), representative images of ankyrin levels obtained using flow cytometry immunofluorescence are reported. Cell samples were observed with a 100× objective. Note the morphological changes in 100 mM d-Gal (arrows). * = p < 0.05 left untreated (control); *** = p < 0.001 control; ° = p < 0.05 versus 100 mM d-Gal; n = 4. (C) Analysis using flow and static cytometry of protein 4.1 expression. Red blood cells were treated for 24 h with 100 mM d-Gal, with or without pre-incubation for 1 h with 10 µg/mL Açaì extract. Bars represent fluorescence intensity values. In panel (C) (right), representative images of protein 4.1 levels obtained using flow cytometry immunofluorescence are reported. Cell samples were observed with a 100× objective. Note the morphological changes in 100 mM d-Gal (arrows). * = p < 0.05 left untreated; *** = p < 0.001 left untreated; °° = p < 0.01 versus 100 mM d-Gal; n = 4.

