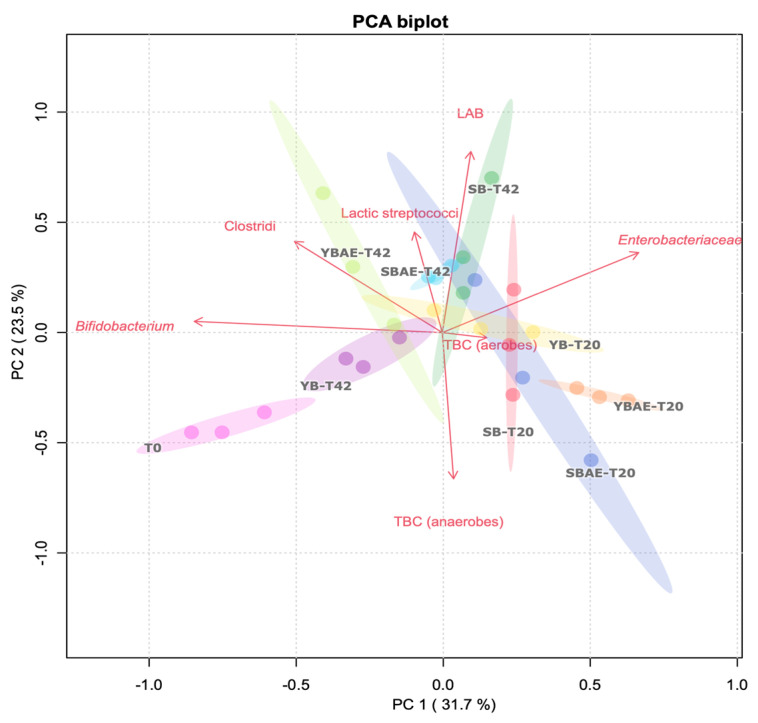
Figure 3.
Biplot of the principal component analysis (PCA) of viable microbial cell densities in fermented fecal batches. Both score and loading plots are shown. The score plot shows fermented fecal batches different for the used bread digest (yeast bread, YB; yeast bread with artichoke extract, YB-AE; sourdough bread, SB; and sourdough bread with artichoke extract, SB-AE) and for the time of fermentation (20 and 42 h, T20 and T42, respectively). Based on normalized values, the loading plot shows the cell densities of the plated microbial groups. Clouds (weighted on the 95th percentile of the confidence interval of three replicates) have different colors for both digested bread and the time of fermentation. Cloud colors represent baseline (that is, the inoculum labeled as T0, pink), YB-T20 (yellow), YB-T42 (purple), YB-AE-T20 (orange), YB-AE-T42 (light green), SB-T20 (red), SB-T42 (green), SB-AE-T20 (blue), and SB-AE-T42 (light blue). Abbreviations: total bacterial count (TBC); lactic acid bacteria (LAB).

