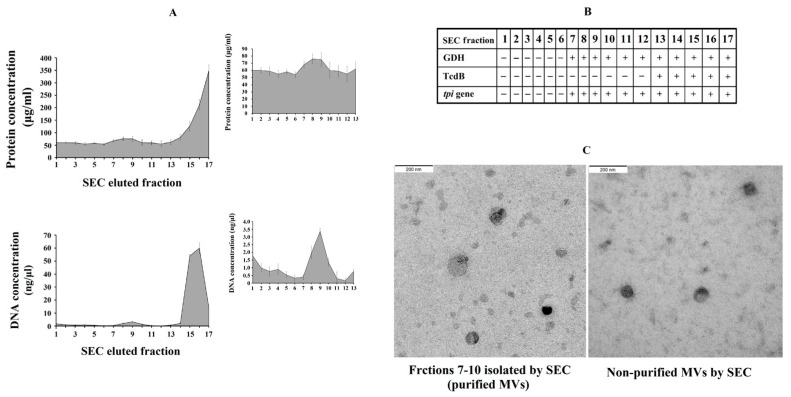
Figure 5.
Analysis of C. difficile-derived MVs-rich eluted fractions after size exclusion chromatography (SEC). (A) Protein and total DNA concentrations of SEC eluted fractions with the magnified part of C. difficile-derived MVs-rich fractions in the upper-right corner. (B) Scheme showing the presence (+) or absence (-) of Glutamate Dehydrogenase Enzyme (GDH), toxin B (TcdB) and tpi gene in the SEC eluted fractions. (C) Characterization by electronic microscopy of the non-purified and purified (fractions 7–10) C. difficile-derived MVs. Data represent mean ± SEM (n = 3).

